Xerox 2011 Annual Report Download - page 42
Download and view the complete annual report
Please find page 42 of the 2011 Xerox annual report below. You can navigate through the pages in the report by either clicking on the pages listed below, or by using the keyword search tool below to find specific information within the annual report.-
 1
1 -
2
-
3
-
4
-
5
-
6
-
7
-
8
-
9
-
10
-
11
-
12
-
13
-
14
-
15
-
16
-
17
-
18
-
19
-
20
-
21
-
22
-
23
-
24
-
25
-
26
-
27
-
28
-
29
-
30
-
31
-
 32
32 -
 33
33 -
 34
34 -
 35
35 -
 36
36 -
 37
37 -
 38
38 -
 39
39 -
 40
40 -
 41
41 -
 42
42 -
 43
43 -
 44
44 -
 45
45 -
 46
46 -
 47
47 -
 48
48 -
 49
49 -
 50
50 -
 51
51 -
 52
52 -
53
-
54
-
55
-
56
-
57
-
58
-
59
-
60
-
61
-
62
-
63
-
64
-
65
-
66
-
67
-
68
-
69
-
70
-
71
-
72
-
73
-
74
-
75
-
76
-
77
-
78
-
79
-
80
-
81
-
82
-
83
-
84
-
85
-
86
-
87
-
88
-
89
-
90
-
91
-
92
-
93
-
94
-
95
-
96
-
97
-
98
-
99
-
100
-
101
-
102
-
103
-
104
-
105
-
106
-
107
-
108
-
109
-
110
-
111
-
112
-
113
-
114
-
115
-
116
 |
 |

Management’s Discussion
40
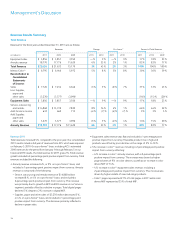
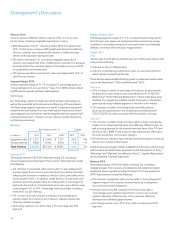
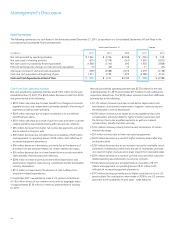
Operations Review of Segment Revenue and Profit
Our reportable segments are consistent with how we manage the business
and view the markets we serve. Our reportable segments are Technology,
Services and Other. Revenues by segment for the three years ended
December 31, 2011 were as follows:
Total Segment Segment
(in millions) Revenue Profit (Loss) Margin
2011
Services $ 10,837 $ 1,207 11.1%
Technology 10,259 1,140 11.1%
Other 1,530 (255) (16.7)%
Total $ 22,626 $ 2,092 9.2%
2010
Services $ 9,637 1,132 11.7%
Technology 10,349 1,085 10.5%
Other 1,647 (342) (20.8)%
Total $ 21,633 $ 1,875 8.7%
2009
Services $ 3,476 $ 231 6.6%
Technology 10,067 949 9.4%
Other 1,636 (342) (20.9)%
Total $ 15,179 $ 838 5.5%
2010 Pro-forma(1)
Services $ 10,256 $ 1,166 11.4%
Technology 10,349 1,085 10.5%
Other 1,647 (353) (21.4)%
Total $ 22,252 $ 1,898 8.5%
2009 Pro-forma(1)
Services $ 9,379 $ 1,008 10.7%
Technology 10,067 949 9.4%
Other 1,636 (447) (27.3)%
Total $ 21,082 $ 1,510 7.2%
Services
Our Services segment comprises three service offerings: Business Process
Outsourcing (“BPO”), Information Technology Outsourcing (“ITO”) and
Document Outsourcing (“DO”). The DO business included within the
Services segment essentially represents Xerox’s pre-ACS acquisition
outsourcing business, as ACS’s outsourcing business is reported as BPO
and ITO revenue.
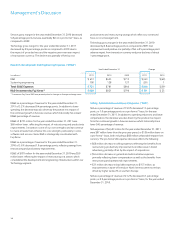
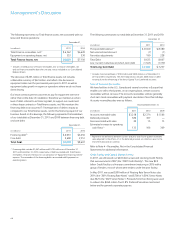
Equity in Net Income of Unconsolidated Affiliates
Year Ended December 31,
(in millions) 2011 2010 2009
Total equity in net income of
unconsolidated affiliates $ 149 $ 78 $ 41
Fuji Xerox after-tax restructuring
costs 19 38 46
Equity in net income of unconsolidated affiliates primarily reflects our
25% share of Fuji Xerox.
The 2011 increase of $71 million was primarily due to an increase in Fuji
Xerox’s net income, which was primarily driven by higher revenue and
cost improvements, as well as the strengthening of the Yen and lower
restructuring costs.
The 2010 increase of $37 million from 2009 was primarily due to an
increase in Fuji Xerox’s net income, which was primarily driven by higher
revenue and cost improvements, as well as lower restructuring costs.
Net Income
Net income attributable to Xerox for the year ended December 31, 2011
was $1,295 million, or $0.90 per diluted share. On an adjusted basis(3),
net income attributable to Xerox was $1,563 million, or $1.08 per diluted
share, and included adjustments for the amortization of intangible assets
and the loss on early extinguishment of liability.
Net income attributable to Xerox for the year ended December 31, 2010
was $606 million, or $0.43 per diluted share. On an adjusted basis(3), net
income attributable to Xerox was $1,296 million, or $0.94 per diluted
share, and included adjustments for the amortization of intangible assets,
restructuring and asset impairment charges (including those incurred by
Fuji Xerox), acquisition-related costs and other discrete costs and expenses.
Refer to the “Non-GAAP Financial Measures” section for the reconciliation
of reported net income to adjusted net income.
Recent Accounting Pronouncements
Refer to Note 1 – Summary of Significant Accounting Policies in the
Consolidated Financial Statements for a description of recent accounting
pronouncements including the respective dates of adoption and the
effects on results of operations and financial conditions.