Xerox 2011 Annual Report Download - page 4
Download and view the complete annual report
Please find page 4 of the 2011 Xerox annual report below. You can navigate through the pages in the report by either clicking on the pages listed below, or by using the keyword search tool below to find specific information within the annual report.-
 1
1 -
 2
2 -
 3
3 -
 4
4 -
 5
5 -
 6
6 -
 7
7 -
 8
8 -
 9
9 -
 10
10 -
 11
11 -
 12
12 -
 13
13 -
 14
14 -
 15
15 -
16
-
17
-
18
-
19
-
20
-
21
-
22
-
23
-
24
-
25
-
26
-
27
-
28
-
29
-
30
-
31
-
32
-
33
-
34
-
35
-
36
-
37
-
38
-
39
-
40
-
41
-
42
-
43
-
44
-
45
-
46
-
47
-
48
-
49
-
50
-
51
-
52
-
53
-
54
-
55
-
56
-
57
-
58
-
59
-
60
-
61
-
62
-
63
-
64
-
65
-
66
-
67
-
68
-
69
-
70
-
71
-
72
-
73
-
74
-
75
-
76
-
77
-
78
-
79
-
80
-
81
-
82
-
83
-
84
-
85
-
86
-
87
-
88
-
89
-
90
-
91
-
92
-
93
-
94
-
95
-
96
-
97
-
98
-
99
-
100
-
101
-
102
-
103
-
104
-
105
-
106
-
107
-
108
-
109
-
110
-
111
-
112
-
113
-
114
-
115
-
116
 |
 |

22
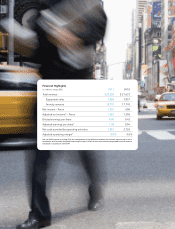
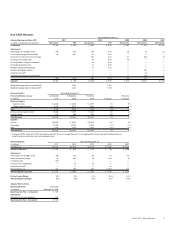
* See non-GAAP measures on Page 9 for the reconciliation of the difference between this financial measure that is not in
compliance with Generally Accepted Accounting Principles (GAAP) and the most directly comparable financial measure
calculated in accordance with GAAP.
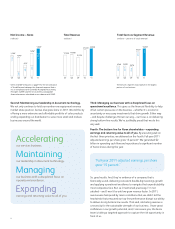
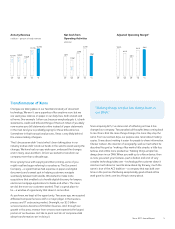
2011 2010
Total revenue $ 22,626 $ 21,633
Equipment sales 3,856 3,857
Annuity revenue 18,770 17,776
Net income – Xerox 1,295 606
Adjusted net income* – Xerox 1,563 1,296
Diluted earnings per share 0.90 0.43
Adjusted earnings per share* 1.08 0.94
Net cash provided by operating activities 1,961 2,726
Adjusted operating margin* 9.8% 9.6%
Financial Highlights
(in millions, except EPS)