Xerox 2007 Annual Report Download - page 93
Download and view the complete annual report
Please find page 93 of the 2007 Xerox annual report below. You can navigate through the pages in the report by either clicking on the pages listed below, or by using the keyword search tool below to find specific information within the annual report.-
 1
1 -
2
-
3
-
4
-
5
-
6
-
7
-
8
-
9
-
10
-
11
-
12
-
13
-
14
-
15
-
16
-
17
-
18
-
19
-
20
-
21
-
22
-
23
-
24
-
25
-
26
-
27
-
28
-
29
-
30
-
31
-
32
-
33
-
34
-
35
-
36
-
37
-
38
-
39
-
40
-
41
-
42
-
43
-
44
-
45
-
46
-
47
-
48
-
49
-
50
-
51
-
52
-
53
-
54
-
55
-
56
-
57
-
58
-
59
-
60
-
61
-
62
-
63
-
64
-
65
-
66
-
67
-
68
-
69
-
70
-
71
-
72
-
73
-
74
-
75
-
76
-
77
-
78
-
79
-
80
-
81
-
82
-
 83
83 -
 84
84 -
 85
85 -
 86
86 -
 87
87 -
 88
88 -
 89
89 -
 90
90 -
 91
91 -
 92
92 -
 93
93 -
 94
94 -
 95
95 -
 96
96 -
 97
97 -
 98
98 -
 99
99 -
 100
100 -
 101
101 -
 102
102 -
 103
103 -
104
-
105
-
106
-
107
-
108
-
109
-
110
-
111
-
112
-
113
-
114
-
115
-
116
-
117
-
118
-
119
-
120
-
121
-
122
-
123
-
124
-
125
-
126
-
127
-
128
-
129
-
130
-
131
-
132
-
133
-
134
-
135
-
136
-
137
-
138
-
139
-
140
 |
 |

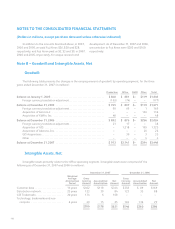
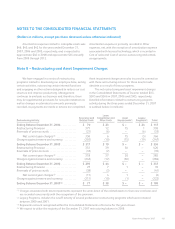
NOTES TO THE CONSOLIDATED FINANCIAL STATEMENTS
(Dollars in millions, except per-share data and unless otherwise indicated)
value-added services, Wide Format Systems, Xerox
Technology Enterprises, royalty and licensing revenues,
GIS network integration solutions and electronic
presentation systems, equity net income and
non-allocated Corporate items. Value-added services
includes the results of our acquisitions of Amici LLC (now
Xerox Litigation Services) and Advectis, Inc. (now Xerox
Mortgage Services). Other segment profit includes the
operating results from these entities, other less significant
businesses, our equity income from Fuji Xerox, and certain
costs which have not been allocated to the Production,
Office and DMO segments, including non-financing
interest as well as other items included in Other expenses,
net.
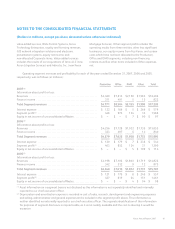
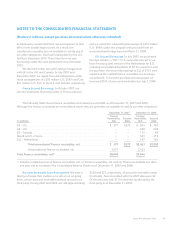
Operating segment revenues and profitability for each of the years ended December 31, 2007, 2006 and 2005,
respectively, was as follows (in millions):
Production Office DMO Other Total
2007(1)
Information about profit or loss:
Revenues ...................................................... $4,460 $7,813 $2,150 $1,983 $16,406
Finance income ................................................ 311 491 5 15 822
Total Segment revenues ....................................... $4,771 $8,304 $2,155 $1,998 $17,228
Interest expense ............................................... $ 122 $ 186 $ 5 $ 266 $ 579
Segment profit(2) ............................................... 448 973 134 33 1,588
Equity in net income of unconsolidated affiliates .................. $ – $ – $ 7 $ 90 $ 97
2006(1)
Information about profit or loss:
Revenues ...................................................... $4,256 $7,128 $1,932 $1,739 $15,055
Finance income ................................................ 323 497 6 14 840
Total Segment revenues ....................................... $4,579 $7,625 $1,938 $1,753 $15,895
Interest expense ............................................... $ 120 $ 179 $ 7 $ 238 $ 544
Segment profit(2) ............................................... 403 832 124 31 1,390
Equity in net income of unconsolidated affiliates .................. $ – $ – $ 5 $ 109 $ 114
2005(1)
Information about profit or loss:
Revenues ...................................................... $4,198 $7,106 $1,803 $1,719 $14,826
Finance income ................................................ 342 512 9 12 875
Total Segment revenues ....................................... $4,540 $7,618 $1,812 $1,731 $15,701
Interest expense ............................................... $ 121 $ 179 $ 8 $ 249 $ 557
Segment profit(2) ............................................... 427 819 64 151 1,461
Equity in net income of unconsolidated affiliates .................. $ – $ – $ 4 $ 94 $ 98
(1) Asset information on a segment basis is not disclosed as this information is not separately identified and internally
reported to our chief executive officer.
(2) Depreciation and amortization expense is recorded in cost of sales, research, development and engineering expenses
and selling, administrative and general expenses and is included in the segment profit above. This information is
neither identified nor internally reported to our chief executive officer. The separate identification of this information
for purposes of segment disclosure is impracticable, as it is not readily available and the cost to develop it would be
excessive.
Xerox Annual Report 2007 91