Xerox 2007 Annual Report Download - page 56
Download and view the complete annual report
Please find page 56 of the 2007 Xerox annual report below. You can navigate through the pages in the report by either clicking on the pages listed below, or by using the keyword search tool below to find specific information within the annual report.-
 1
1 -
2
-
3
-
4
-
5
-
6
-
7
-
8
-
9
-
10
-
11
-
12
-
13
-
14
-
15
-
16
-
17
-
18
-
19
-
20
-
21
-
22
-
23
-
24
-
25
-
26
-
27
-
28
-
29
-
30
-
31
-
32
-
33
-
34
-
35
-
36
-
37
-
38
-
39
-
40
-
41
-
42
-
43
-
44
-
45
-
 46
46 -
 47
47 -
 48
48 -
 49
49 -
 50
50 -
 51
51 -
 52
52 -
 53
53 -
 54
54 -
 55
55 -
 56
56 -
 57
57 -
 58
58 -
 59
59 -
 60
60 -
 61
61 -
 62
62 -
 63
63 -
 64
64 -
 65
65 -
 66
66 -
67
-
68
-
69
-
70
-
71
-
72
-
73
-
74
-
75
-
76
-
77
-
78
-
79
-
80
-
81
-
82
-
83
-
84
-
85
-
86
-
87
-
88
-
89
-
90
-
91
-
92
-
93
-
94
-
95
-
96
-
97
-
98
-
99
-
100
-
101
-
102
-
103
-
104
-
105
-
106
-
107
-
108
-
109
-
110
-
111
-
112
-
113
-
114
-
115
-
116
-
117
-
118
-
119
-
120
-
121
-
122
-
123
-
124
-
125
-
126
-
127
-
128
-
129
-
130
-
131
-
132
-
133
-
134
-
135
-
136
-
137
-
138
-
139
-
140
 |
 |

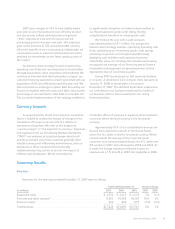
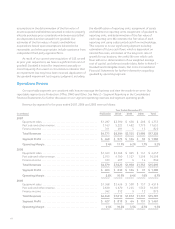
Reconciliation to Consolidated Statements of Income
(in millions)
Year Ended December 31,
2007 2006 2005
Sales ............................................................................ $ 8,192 $ 7,464 $ 7,400
Less: Supplies, paper and other sales ................................................ (3,439) (3,007) (2,881)
Equipment sales .................................................................. $ 4,753 $ 4,457 $ 4,519
Service, outsourcing and rentals .................................................... $ 8,214 $ 7,591 $ 7,426
Add: Supplies, paper and other sales ................................................ 3,439 3,007 2,881
Post sale and other revenue ....................................................... $11,653 $10,598 $10,307
Memo: Color(2) ................................................................... $ 6,356 $ 5,578 $ 4,928
Total 2007 revenue increased 8% compared to the
prior year and includes the results of GIS since May 9,
2007, the effective date of the acquisition. When
including GIS in our 2006 results(3), our 2007 total revenue
increased 4%. Currency had a 3-percentage point positive
impact on total revenues. Total revenues included the
following:
• 9% increase in post sale, financing and other revenue,
or 6% including GIS in our 2006 results(3). This
included a 3-percentage point benefit from currency.
Growth in GIS, color products, DMO and document
management services more than offset the decline in
black-and-white digital office revenue and light lens
products:
• 8% increase in service, outsourcing, and rentals
revenue to $8,214 million reflected the inclusion of
GIS, growth in document management services
and technical service revenue. Supplies, paper, and
other sales of $3,439 million grew 14% year-over-
year due to the inclusion of GIS as well as growth
in DMO.
• 7% increase in equipment sales revenue, or a decrease
of 1% when including GIS in our 2006 results(3). This
included a 3-percentage point benefit from currency.
Growth in office multifunction color and production
color install activity was offset by overall price declines
of between 5%–10%, declines in production
black-and-white products and color printers, as well as
an increased proportion of equipment installed under
operating lease contracts where revenue is recognized
over-time in post sale.
• 14% growth in color revenue(2). Color revenue of
$6,356 million comprised 39% of total revenue,
compared to 35% in 2006 reflecting:
• 18% growth in color post sale, financing and other
revenue. Color represented 35% and 31% of post
sale, financing and other revenue, in 2007 and
2006, respectively(4).
• 7% growth in color equipment sales revenue.
Color sales represented 49% and 45% of total
equipment sales, in 2007 and 2006, respectively(4).
• 31% growth in color pages. Color pages
represented 12% and 9% of total pages, in 2007
and 2006, respectively(4).
Total 2006 revenue increased 1% from the prior
year. There was a negligible impact from currency. Total
revenue included the following:
• 1% decline in equipment sales, including a benefit
from currency of 1-percentage point, primarily
reflecting revenue declines in Office and high-end
production black-and-white products, partially offset
by revenue growth from color products and growth in
DMO. Strong install activity in color products and
office black-and-white products including, entry
production color, iGen3 and office multifunction color
products, partially offset by overall price declines.
Approximately two-thirds of 2006 equipment sales
were generated from products launched in the past 24
months.
• 3% growth in post sale and other revenue, including a
benefit from currency of 1-percentage point, primarily
reflecting growth in digital Office and Production
products, DMO, and value-added services offset by
declines in light lens and licensing revenue. Analog
revenues of $302 million represented 3% of 2006 post
sale revenue compared to $494 million or 5% of 2005
post sale revenue.
• 4% decline in Finance income, including a benefit
from currency of 1-percentage point, reflecting lower
average finance receivables.
• 13% growth in color revenue. Color revenue of $5,578
million comprised 35% of total revenue in 2006
compared to 31% in 2005.
54