Xerox 2007 Annual Report Download - page 70
Download and view the complete annual report
Please find page 70 of the 2007 Xerox annual report below. You can navigate through the pages in the report by either clicking on the pages listed below, or by using the keyword search tool below to find specific information within the annual report.-
 1
1 -
2
-
3
-
4
-
5
-
6
-
7
-
8
-
9
-
10
-
11
-
12
-
13
-
14
-
15
-
16
-
17
-
18
-
19
-
20
-
21
-
22
-
23
-
24
-
25
-
26
-
27
-
28
-
29
-
30
-
31
-
32
-
33
-
34
-
35
-
36
-
37
-
38
-
39
-
40
-
41
-
42
-
43
-
44
-
45
-
46
-
47
-
48
-
49
-
50
-
51
-
52
-
53
-
54
-
55
-
56
-
57
-
58
-
59
-
 60
60 -
 61
61 -
 62
62 -
 63
63 -
 64
64 -
 65
65 -
 66
66 -
 67
67 -
 68
68 -
 69
69 -
 70
70 -
 71
71 -
 72
72 -
 73
73 -
 74
74 -
 75
75 -
 76
76 -
 77
77 -
 78
78 -
 79
79 -
 80
80 -
81
-
82
-
83
-
84
-
85
-
86
-
87
-
88
-
89
-
90
-
91
-
92
-
93
-
94
-
95
-
96
-
97
-
98
-
99
-
100
-
101
-
102
-
103
-
104
-
105
-
106
-
107
-
108
-
109
-
110
-
111
-
112
-
113
-
114
-
115
-
116
-
117
-
118
-
119
-
120
-
121
-
122
-
123
-
124
-
125
-
126
-
127
-
128
-
129
-
130
-
131
-
132
-
133
-
134
-
135
-
136
-
137
-
138
-
139
-
140
 |
 |

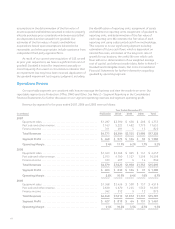
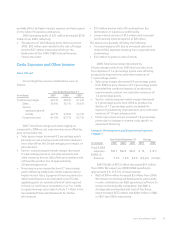
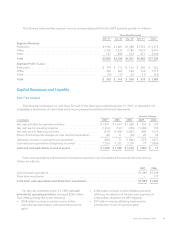
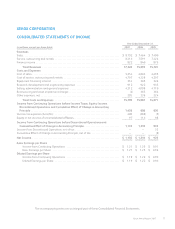
2008 Segment Reporting Change
In the first quarter of 2008, we will be revising our segment reporting to integrate DMO into the Production, Office
and Other segments. DMO is a geography which has matured to a level where we will begin to manage it consistent with
our North American and European geographies, which is on the basis of products sold. However, we will continue to
provide DMO’s revenue and profit as a supplemental disclosure through 2008.
Segment Revenue and Profit, as presented below, were reclassified for the above change, as well as for certain other
miscellaneous revenue and expense reallocations. The following table reflects the restatement of selected financial
information for our operating segments for each of the years ended December 31, 2007, 2006 and 2005, respectively,
on the new basis (in millions):
Production Office Other Total
2007
Equipment sales .................................................... $1,471 $3,030 $ 252 $ 4,753
Post sale and other revenue .......................................... 3,530 5,950 2,173 11,653
Finance income ..................................................... 314 493 15 822
Total Segment revenues ............................................ $5,315 $9,473 $2,440 $17,228
Segment profit ..................................................... $ 562 $1,115 $ (89) $ 1,588
Operating Margin .................................................. 10.6% 11.8% (3.7)% 9.2%
2006
Equipment sales .................................................... $1,491 $2,786 $ 180 $ 4,457
Post sale and other revenue .......................................... 3,244 5,421 1,933 10,598
Finance income ..................................................... 320 505 15 840
Total Segment revenues ............................................ $5,055 $8,712 $2,128 $15,895
Segment profit ..................................................... $ 504 $1,010 $ (124) $ 1,390
Operating Margin .................................................. 10.0% 11.6% (5.8)% 8.7%
2005
Equipment sales .................................................... $1,492 $2,830 $ 197 $ 4,519
Post sale and other revenue .......................................... 3,126 5,300 1,881 10,307
Finance income ..................................................... 346 516 13 875
Total Segment revenues ............................................ $4,964 $8,646 $2,091 $15,701
Segment profit ..................................................... $ 517 $ 931 $ 13 $ 1,461
Operating Margin .................................................. 10.4% 10.8% 0.6% 9.3%
68