Xerox 2007 Annual Report Download - page 67
Download and view the complete annual report
Please find page 67 of the 2007 Xerox annual report below. You can navigate through the pages in the report by either clicking on the pages listed below, or by using the keyword search tool below to find specific information within the annual report.-
 1
1 -
2
-
3
-
4
-
5
-
6
-
7
-
8
-
9
-
10
-
11
-
12
-
13
-
14
-
15
-
16
-
17
-
18
-
19
-
20
-
21
-
22
-
23
-
24
-
25
-
26
-
27
-
28
-
29
-
30
-
31
-
32
-
33
-
34
-
35
-
36
-
37
-
38
-
39
-
40
-
41
-
42
-
43
-
44
-
45
-
46
-
47
-
48
-
49
-
50
-
51
-
52
-
53
-
54
-
55
-
56
-
 57
57 -
 58
58 -
 59
59 -
 60
60 -
 61
61 -
 62
62 -
 63
63 -
 64
64 -
 65
65 -
 66
66 -
 67
67 -
 68
68 -
 69
69 -
 70
70 -
 71
71 -
 72
72 -
 73
73 -
 74
74 -
 75
75 -
 76
76 -
 77
77 -
78
-
79
-
80
-
81
-
82
-
83
-
84
-
85
-
86
-
87
-
88
-
89
-
90
-
91
-
92
-
93
-
94
-
95
-
96
-
97
-
98
-
99
-
100
-
101
-
102
-
103
-
104
-
105
-
106
-
107
-
108
-
109
-
110
-
111
-
112
-
113
-
114
-
115
-
116
-
117
-
118
-
119
-
120
-
121
-
122
-
123
-
124
-
125
-
126
-
127
-
128
-
129
-
130
-
131
-
132
-
133
-
134
-
135
-
136
-
137
-
138
-
139
-
140
 |
 |

Worldwide Employment
Worldwide employment of 57,400 as of
December 31, 2007 increased approximately 3,700 from
December 31, 2006, primarily reflecting the addition of
GIS personnel and the hiring of former contract
employees in certain Latin American subsidiaries, partially
offset by reductions from the 2006 restructuring
programs. Worldwide employment was approximately
53,700 and 55,200 at December 31, 2006 and 2005,
respectively.
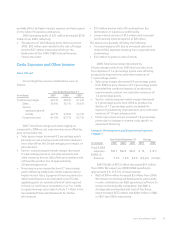
Other Expenses, Net
Other expenses, net for the three years ended December 31, 2007 consisted of the following:
Year Ended December 31,
(in millions) 2007 2006 2005
Non-financing interest expense ............................................... $263 $239 $ 231
Interest income .............................................................. (55) (69) (138)
Gain on sales of businesses and assets ......................................... (7) (44) (97)
Currency losses, net .......................................................... 8 39 5
Amortization of intangible assets .............................................. 42 41 38
Legal matters ................................................................ (6) 89 115
Minorities’ interests in earnings of subsidiaries .................................. 30 22 15
Loss on extinguishment of debt ............................................... – 15 –
All other expenses, net ........................................................ 20 4 55
Total Other expenses, net ..................................................... $295 $336 $ 224
Non-financing interest expense: In 2007
non-financing interest expense increased primarily due to
higher average debt balances as well as higher rates. In
2006 non-financing interest expense increased due to
higher interest rates partially offset by lower average debt
balances.
Interest income: Interest income is derived primarily
from our invested cash and cash equivalent balances. The
decline in interest income in 2007 was primarily due to
lower average cash balances partially offset by higher
rates. The decline in 2006 was primarily because 2005
included $57 million of interest income associated with
the 2005 settlement of the 1996-1998 IRS audit as well as
lower average cash balances partially offset by higher
rates of return.
Gain on sales of businesses and assets: 2006 gain on
sales of businesses and assets primarily consisted of the
following:
• $15 million on the sale of our Corporate headquarters.
• $11 million on the sale of a manufacturing facility.
• $10 million receipt from escrow of additional proceeds
related to our 2005 sale of Integic.
In 2005, gain on sales of businesses and assets
primarily consist of the $93 million gain on the sale of
Integic.
Currency (gains) losses net: Currency gains and losses
primarily result from the re-measurement of foreign
currency-denominated assets and liabilities, the cost of
hedging foreign currency-denominated assets and
liabilities, the mark-to-market of any foreign exchange
contracts utilized to hedge those foreign currency-
denominated assets and liabilities and the mark-to-market
impact of hedges of anticipated transactions, primarily
future inventory purchases, for those we do not apply cash
flow hedge accounting treatment.
In 2007, 2006 and 2005 currency losses totaled $8
million, $39 million and $5 million, respectively. The 2006
increase in currency losses primarily reflected the
mark-to-market of derivative contracts which are
economically hedging anticipated foreign currency
denominated payments. The mark-to-market losses were
primarily due to the strengthening of the Euro against
other currencies, in particular the Canadian Dollar,
U.S. Dollar and Japanese Yen, as compared to the
weakening Euro in 2005.
Amortization of intangible assets: 2007 amortization
of intangible assets expense of $42 million reflects
amortization expense of $16 million associated with
intangible assets acquired as part of our acquisition of
GIS, partially offset by reduced amortization from prior
Xerox Annual Report 2007 65