Xerox 2007 Annual Report Download - page 78
Download and view the complete annual report
Please find page 78 of the 2007 Xerox annual report below. You can navigate through the pages in the report by either clicking on the pages listed below, or by using the keyword search tool below to find specific information within the annual report.-
 1
1 -
2
-
3
-
4
-
5
-
6
-
7
-
8
-
9
-
10
-
11
-
12
-
13
-
14
-
15
-
16
-
17
-
18
-
19
-
20
-
21
-
22
-
23
-
24
-
25
-
26
-
27
-
28
-
29
-
30
-
31
-
32
-
33
-
34
-
35
-
36
-
37
-
38
-
39
-
40
-
41
-
42
-
43
-
44
-
45
-
46
-
47
-
48
-
49
-
50
-
51
-
52
-
53
-
54
-
55
-
56
-
57
-
58
-
59
-
60
-
61
-
62
-
63
-
64
-
65
-
66
-
67
-
 68
68 -
 69
69 -
 70
70 -
 71
71 -
 72
72 -
 73
73 -
 74
74 -
 75
75 -
 76
76 -
 77
77 -
 78
78 -
 79
79 -
 80
80 -
 81
81 -
 82
82 -
 83
83 -
 84
84 -
 85
85 -
 86
86 -
 87
87 -
 88
88 -
89
-
90
-
91
-
92
-
93
-
94
-
95
-
96
-
97
-
98
-
99
-
100
-
101
-
102
-
103
-
104
-
105
-
106
-
107
-
108
-
109
-
110
-
111
-
112
-
113
-
114
-
115
-
116
-
117
-
118
-
119
-
120
-
121
-
122
-
123
-
124
-
125
-
126
-
127
-
128
-
129
-
130
-
131
-
132
-
133
-
134
-
135
-
136
-
137
-
138
-
139
-
140
 |
 |

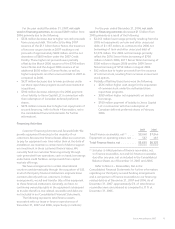
permanently invested in foreign subsidiaries and affiliates,
primarily Xerox Limited, Fuji Xerox, Xerox Canada Inc. and
Xerox do Brasil, and translated into dollars using the
year-end exchange rates, was $7.1 billion at December 31,
2007.
Interest Rate Risk Management: The consolidated
weighted-average interest rates related to our debt and
liabilities to subsidiary trust issuing preferred securities for
2007, 2006 and 2005 approximated 7.1%, 6.8%, and
6.0%, respectively. Interest expense includes the impact
of our interest rate derivatives.
Virtually all customer-financing assets earn fixed
rates of interest. The interest rates on a significant portion
of the company’s term debt are fixed.
As of December 31, 2007, approximately $2.1 billion
of our debt and liability to subsidiary trust issuing
preferred securities carried variable interest rates,
including the effect of pay-variable interest rate swaps we
are utilizing with the intent to reduce the effective interest
rate on our high coupon debt.
The fair market values of our fixed-rate financial
instruments are sensitive to changes in interest rates. At
December 31, 2007, a 10% change in market interest
rates would change the fair values of such financial
instruments by approximately $221 million.
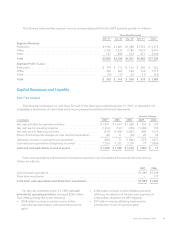
Non-GAAP Financial Measures
We reported our financial results in accordance with generally accepted accounting principles (“GAAP”). In addition,
we discussed our revenue growth for the year ended December 31, 2007 using non-GAAP financial measures.
Management believes these measures give investors an additional perspective of revenue trends, as well as the impact to
the company of the acquisition of GIS in May 2007. To understand these trends in the business, we believe that it is
helpful to adjust revenue to illustrate the impact on revenue growth rates of our acquisition of GIS. We have done this by
including GIS’ revenue for the comparable 2006 period. We refer to this adjusted revenue as “adjusted revenue” in the
following reconciliation table. Management believes that these non-GAAP financial measures can provide an additional
means of analyzing the current periods’ results against the corresponding prior periods’ results. However, all of these
non-GAAP financial measures should be viewed in addition to, and not as a substitute for, the company’s reported results
prepared in accordance with GAAP. A reconciliation of these non-GAAP financial measures and the most directly
comparable financial measures calculated and presented in accordance with GAAP is as follows:
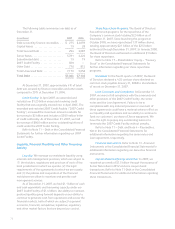
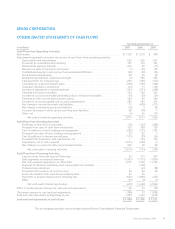
(in millions) Year Ended December 31,
% Change2007 2006
Equipment Sales Revenue:
As Reported .............................................................. $ 4,753 $ 4,457 7%
As Adjusted .............................................................. $ 4,753 $ 4,821 (1)%
Post Sale, Financing & Other Revenue:
As Reported .............................................................. $12,475 $11,438 9%
As Adjusted .............................................................. $12,475 $11,812 6%
Total Revenues:
As Reported .............................................................. $17,228 $15,895 8%
As Adjusted .............................................................. $17,228 $16,633 4%
Revenue “As Adjusted” adds GIS’s results for the period from May 9, 2006, through December 31, 2006 to our 2006
reported revenue.
Forward-Looking Statements
This Annual Report contains forward-looking
statements as defined in the Private Securities Litigation
Reform Act of 1995. The words “anticipate,” “believe,”
“estimate,”“expect,”“intend,”“will,”“should”andsimilar
expressions, as they relate to us, are intended to identify
forward-looking statements. These statements reflect
management’s current beliefs, assumptions and
expectations and are subject to a number of factors that
may cause actual results to differ materially. Information
concerning these factors is included in our 2007 Annual
Report on Form 10-K filed with the Securities and
Exchange Commission (“SEC”). We do not intend to
update these forward-looking statements, except as
required by law.
76