Xerox 2007 Annual Report Download - page 115
Download and view the complete annual report
Please find page 115 of the 2007 Xerox annual report below. You can navigate through the pages in the report by either clicking on the pages listed below, or by using the keyword search tool below to find specific information within the annual report.-
 1
1 -
2
-
3
-
4
-
5
-
6
-
7
-
8
-
9
-
10
-
11
-
12
-
13
-
14
-
15
-
16
-
17
-
18
-
19
-
20
-
21
-
22
-
23
-
24
-
25
-
26
-
27
-
28
-
29
-
30
-
31
-
32
-
33
-
34
-
35
-
36
-
37
-
38
-
39
-
40
-
41
-
42
-
43
-
44
-
45
-
46
-
47
-
48
-
49
-
50
-
51
-
52
-
53
-
54
-
55
-
56
-
57
-
58
-
59
-
60
-
61
-
62
-
63
-
64
-
65
-
66
-
67
-
68
-
69
-
70
-
71
-
72
-
73
-
74
-
75
-
76
-
77
-
78
-
79
-
80
-
81
-
82
-
83
-
84
-
85
-
86
-
87
-
88
-
89
-
90
-
91
-
92
-
93
-
94
-
95
-
96
-
97
-
98
-
99
-
100
-
101
-
102
-
103
-
104
-
 105
105 -
 106
106 -
 107
107 -
 108
108 -
 109
109 -
 110
110 -
 111
111 -
 112
112 -
 113
113 -
 114
114 -
 115
115 -
 116
116 -
 117
117 -
 118
118 -
 119
119 -
 120
120 -
 121
121 -
 122
122 -
 123
123 -
 124
124 -
 125
125 -
126
-
127
-
128
-
129
-
130
-
131
-
132
-
133
-
134
-
135
-
136
-
137
-
138
-
139
-
140
 |
 |

NOTES TO THE CONSOLIDATED FINANCIAL STATEMENTS
(Dollars in millions, except per-share data and unless otherwise indicated)
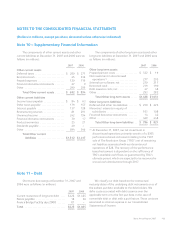
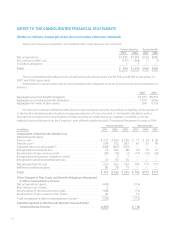
(1) Interest cost includes interest expense on non-TRA obligations of $374, $340, and $328 and interest expense directly
allocated to TRA participant accounts of $204, $392, and $253 for the years ended December 31, 2007, 2006 and
2005, respectively.
(2) Expected return on plan assets includes expected investment income on non-TRA assets of $464, $410, and $369 and
actual investment income on TRA assets of $204, $392, and $253 for the years ended December 31, 2007, 2006 and
2005, respectively.
(3) Amount represents the pre-tax effect included within other comprehensive income. The net of tax amount and effect
of translation adjustments are included within the Consolidated Statements of Common Shareholders’ Equity.
The net actuarial loss and prior service credit for the
defined benefit pension plans that will be amortized from
accumulated other comprehensive loss into net periodic
benefit cost over the next fiscal year are $38 and $(21),
respectively. The net actuarial loss and prior service credit
for the other defined benefit postretirement plans that will
be amortized from accumulated other comprehensive loss
into net periodic benefit cost over the next fiscal year are
$2 and $(12) respectively.
Pension plan assets consist of both defined benefit
plan assets and assets legally restricted to the TRA
accounts. The combined investment results for these plans,
along with the results for our other defined benefit plans,
are shown above in the actual return on plan assets
caption. To the extent that investment results relate to
TRA, such results are charged directly to these accounts as
a component of interest cost.
Plan Amendment
During 2006 we amended one of our domestic
defined benefit pension plans. The amendment changed
the process of calculating benefits for certain employees
who retire from or leave the Company after 2012. The new
process ensures that certain benefit enhancements are
only provided to plan participants who qualify to receive
them based on age and years of service at termination.
The prior process for years after 2012 provided some plan
participants with these benefit enhancements regardless
of qualification. The amendment resulted in a net
decrease of $173 in the Projected Benefit Obligation and a
net decrease of $20 in the Accumulated Benefit
Obligation. The amendment also decreased net periodic
pension benefit cost by $31 for the full year 2006.
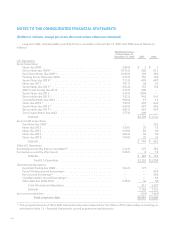
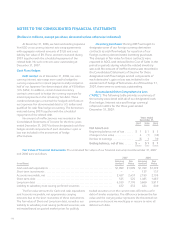
Plan Assets
Current Allocation and Investment Targets: As of
the 2007 and 2006 measurement dates, the global
pension plan assets were $9.8 billion and $9.2 billion,
respectively. These assets were invested among several
asset classes. None of the investments include debt or
equity securities of Xerox Corporation. The amount and
percentage of assets invested in each asset class as of
December 31, 2007 and 2006 is shown below:
Asset Value Percentage of
Total Assets
(in millions) 2007 2006 2007 2006
Asset Category
Equity securities ....... $5,060 $4,971 52% 54%
Debt securities ......... 3,973 3,319 40 36
Real estate ............ 720 728 7 8
Other ................. 52 199 1 2
Total ................ $9,805 $9,217 100% 100%
Investment Strategy: The target asset allocations for
our worldwide plans for 2007 were 50% invested in
equities, 42% invested in fixed income, 7% invested in
real estate and 1% invested in Other. The target asset
allocations for our worldwide plans for 2006 were 53%
invested in equities, 39% invested in fixed income, 7%
invested in real estate and 1% invested in Other. The
pension assets outside of the U.S. as of the 2007 and 2006
measurement dates were $5.7 billion and $5.1 billion,
respectively.
The target asset allocations for the U.S. pension plan
include 60% invested in equities, 35% in fixed income and
5% in real estate. Cash investments are sufficient to
handle expected cash requirements for benefit payments
and will vary throughout the year. The expected long-term
rate of return on the U.S. pension assets is 8.75%.
Xerox Annual Report 2007 113