Xerox 2007 Annual Report Download - page 131
Download and view the complete annual report
Please find page 131 of the 2007 Xerox annual report below. You can navigate through the pages in the report by either clicking on the pages listed below, or by using the keyword search tool below to find specific information within the annual report.-
 1
1 -
2
-
3
-
4
-
5
-
6
-
7
-
8
-
9
-
10
-
11
-
12
-
13
-
14
-
15
-
16
-
17
-
18
-
19
-
20
-
21
-
22
-
23
-
24
-
25
-
26
-
27
-
28
-
29
-
30
-
31
-
32
-
33
-
34
-
35
-
36
-
37
-
38
-
39
-
40
-
41
-
42
-
43
-
44
-
45
-
46
-
47
-
48
-
49
-
50
-
51
-
52
-
53
-
54
-
55
-
56
-
57
-
58
-
59
-
60
-
61
-
62
-
63
-
64
-
65
-
66
-
67
-
68
-
69
-
70
-
71
-
72
-
73
-
74
-
75
-
76
-
77
-
78
-
79
-
80
-
81
-
82
-
83
-
84
-
85
-
86
-
87
-
88
-
89
-
90
-
91
-
92
-
93
-
94
-
95
-
96
-
97
-
98
-
99
-
100
-
101
-
102
-
103
-
104
-
105
-
106
-
107
-
108
-
109
-
110
-
111
-
112
-
113
-
114
-
115
-
116
-
117
-
118
-
119
-
120
-
 121
121 -
 122
122 -
 123
123 -
 124
124 -
 125
125 -
 126
126 -
 127
127 -
 128
128 -
 129
129 -
 130
130 -
 131
131 -
 132
132 -
 133
133 -
 134
134 -
 135
135 -
 136
136 -
 137
137 -
 138
138 -
 139
139 -
 140
140
 |
 |

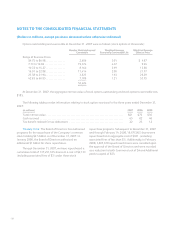
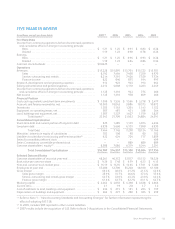
NOTES TO THE CONSOLIDATED FINANCIAL STATEMENTS
(Dollars in millions, except per-share data and unless otherwise indicated)
A summary of the activity for PSs as of December 31, 2007, 2006 and 2005, and changes during the years then
ended, is presented below (shares in thousands):
2007 2006 2005
Nonvested Performance Shares Shares
Weighted
Average Grant
Date Fair
Value Shares
Weighted
Average Grant
Date Fair
Value Shares
Weighted
Average Grant
Date Fair
Value
Outstanding at January 1 ...................... 4,571 $15.04 2,052 $14.87 – $ –
Granted ...................................... 2,160 18.48 2,588 15.17 2,070 14.87
Vested ....................................... – – – – – –
Cancelled .................................... (146) 15.41 (69) 14.95 (18) 14.87
Outstanding at December 31 ............... 6,585 16.16 4,571 15.04 2,052 14.87
At December 31, 2007, the aggregate intrinsic value
of PSs outstanding was $107.
Prior to 2006, the PSs were accounted for as variable
awards requiring that the shares be adjusted to market
value at each reporting period. Effective January 1, 2006,
upon the adoption of FAS 123(R), PSs were recorded
prospectively using fair value determined as of the grant
date. If the stated targets are not met, any recognized
compensation cost would be reversed. As of December 31,
2007, there was $63 of total unrecognized compensation
cost related to nonvested PSs; this cost is expected to be
recognized ratably over a remaining weighted-average
contractual term of 1.8 years.
Stock Options: Stock options generally vest over a period of three years and expire between eight and ten years
from the date of grant. The following table provides information relating to the status of, and changes in, stock options
granted for each of the three years ended December 31, 2007 (stock options in thousands):
2007 2006 2005
Employee Stock Options Stock
Options
Average
Option
Price Stock
Options
Average
Option
Price Stock
Options
Average
Option
Price
Outstanding at January 1 ................................ 60,480 $18.56 76,307 $19.40 91,833 $20.98
Granted ................................................ – – – – – –
Cancelled/Expired ....................................... (922) 24.18 (5,478) 49.44 (10,291) 39.41
Exercised ............................................... (7,134) 9.22 (10,349) 8.46 (5,235) 7.74
Outstanding at December 31 ......................... 52,424 19.73 60,480 18.56 76,307 19.40
Exercisable at December 31 ........................... 52,424 60,180 66,928
Xerox Annual Report 2007 129