Xerox 2007 Annual Report Download - page 102
Download and view the complete annual report
Please find page 102 of the 2007 Xerox annual report below. You can navigate through the pages in the report by either clicking on the pages listed below, or by using the keyword search tool below to find specific information within the annual report.
NOTES TO THE CONSOLIDATED FINANCIAL STATEMENTS
(Dollars in millions, except per-share data and unless otherwise indicated)
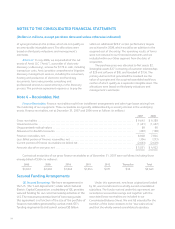
In addition to the amounts described above, in 2007,
2006 and 2005, we paid Fuji Xerox $26, $28 and $28,
respectively, and Fuji Xerox paid us $2, $3 and $9, in 2007,
2006 and 2005, respectively, for unique research and
development. As of December 31, 2007 and 2006,
amounts due to Fuji Xerox were $205 and $169,
respectively.
Note 8 – Goodwill and Intangible Assets, Net
Goodwill:
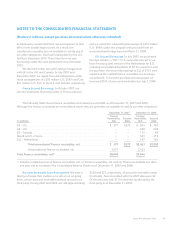
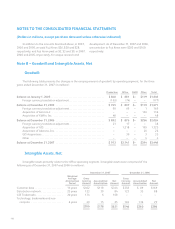
The following table presents the changes in the carrying amount of goodwill, by operating segment, for the three
years ended December 31, 2007 (in millions):
Production Office DMO Other Total
Balance at January 1, 2005 .......................................... $ 848 $ 881 $– $119 $1,848
Foreign currency translation adjustment ........................... (103) (74) – – (177)
Balance at December 31, 2005 ...................................... $ 745 $ 807 $– $119 $1,671
Foreign currency translation adjustment ........................... 99 69 – 1 169
Acquisition of Amici LLC ......................................... – – – 136 136
Acquisition of XMPie, Inc. ........................................ 48 – – – 48
Balance at December 31, 2006 ...................................... $ 892 $ 876 $– $256 $2,024
Foreign currency translation adjustment ........................... 21 17 – – 38
Acquisition of GIS ............................................... – 1,218 – 105 1,323
Acquisition of Advectis, Inc. ...................................... – – – 26 26
GIS Acquisitions ................................................. – 30 – 3 33
Other .......................................................... – – – 4 4
Balance at December 31, 2007 ...................................... $ 913 $2,141 $– $394 $3,448
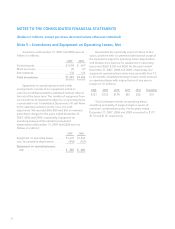
Intangible Assets, Net:
Intangible assets primarily relate to the Office operating segment. Intangible assets were comprised of the
following as of December 31, 2007 and 2006 (in millions):
December 31, 2007 December 31, 2006
Weighted
Average
Amortization
Period
Gross
Carrying
Amount Accumulated
Amortization Net
Amount
Gross
Carrying
Amount Accumulated
Amortization Net
Amount
Customer base ...................... 14years $462 $118 $344 $258 $ 89 $169
Distribution network ................. 25years 123 39 84 123 35 88
GIS Trademarks ..................... 20years 174 6 168 – – –
Technology, trademarks and non-
compete ......................... 6years 40 15 25 165 136 29
$799 $178 $621 $546 $260 $286
100


