Xerox 2007 Annual Report Download - page 72
Download and view the complete annual report
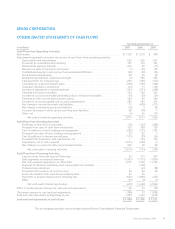
Please find page 72 of the 2007 Xerox annual report below. You can navigate through the pages in the report by either clicking on the pages listed below, or by using the keyword search tool below to find specific information within the annual report.• $30 million increase as a result of lower restructuring
payments due to minimal activity in 2007.
• $114 million decrease due to year-over-year inventory
growth of $54 million primarily related to increased
product launches in 2007, as well as a $60 million
increase in equipment on operating leases reflecting
higher operating lease install activity.
• $73 million decrease due to a lower net run-off of
finance receivables.
• $49 million decrease primarily due to higher accounts
receivable reflecting increased revenue, partially offset
by $110 million year-over-year benefit from increased
receivables sales.
• $45 million decrease due to lower benefit accruals,
partially offset by higher accounts payable due to the
timing of payments to vendors and suppliers.
For the year ended December 31, 2006, net cash
provided by operating activities, increased $197 million
from 2005 primarily as a result of the increased net
income of $232 million, as well as the following additional
items:
• $173 million increase due to lower inventories.
• $87 million increase due to lower net tax payments
including a $34 million refund associated with the
settlement of the 1999 to 2003 IRS tax audit.
• $62 million decrease due to a lower net run-off of
finance receivables.
• $51 million decrease due to higher restructuring
payments related to previously reported actions.
• $96 million decrease due to a lower year-over-year
reduction in other current and long-term assets.
• $77 million decrease due to a reduction in other
current and long-term liabilities, primarily reflecting a
$106 million payment relating to the previously
disclosed MPI legal matter.
For the year ended December 31, 2007, net cash
used in investing activities, increased $1,469 million from
2006 primarily due to the following:
• $1,386 million increase due to $1,615 million in 2007
acquisitions primarily comprised of $1,568 for GIS and
its additional acquisitions and $30 million for Advectis,
Inc., as compared to $229 million in acquisitions in
2006 comprised of Amici, LLC and XMPie, Inc.
• $153 million increase reflecting the absence of the
2006 $122 million distribution related to the sale of
investments held by Ridge Re* and the $21 million
distribution from the liquidation of our investment in
Xerox Capital LLC.
• $57 million increase due to higher 2006 proceeds from
sales of land, buildings and equipment, which included
the sale of our corporate headquarters and a parcel of
vacant land.
• $65 million increase due to higher capital and internal
use software investments in 2007.
• $162 million decrease due to a reduction in escrow
and other restricted investments in 2007, as we
continue to run-off our secured borrowing programs.
For the year ended December 31, 2006, net cash
from investing activities increased $152 million from
2005 primarily as a result of the following:
• $354 million increase due to proceeds from the net
sale of short-term investments in 2006 of $107 million,
as compared to the net purchases of $247 million in
2005, as 2005 represented the initial year we
purchased short-term investments to supplement our
investment income.
• $77 million increase due to proceeds from the sale of
our Corporate headquarters and other excess land and
buildings.
• $48 million increase due to proceeds from divestitures
and investments, reflecting:
• $122 million related to the sale of investments
held by Ridge Re* in 2006.
• $21 million distribution from the liquidation of our
investment in a subsidiary trust in 2006.
• $96 million of proceeds from the sale of Integic in
2005.
• Partially offsetting these items were the following:
• $229 million due to payments related to the
acquisition of Amici, LLC and XMPie, Inc.
• $57 million increase in capital expenditures and
internal use software.
• Lower cash generation of $42 million due to a
lower net reduction of escrow and other restricted
investments.
*In March 2006 Ridge Re, a wholly owned
subsidiary included in discontinued operations,
executed an agreement to complete its exit
from the insurance business. As a result of this
agreement and pursuant to a liquidation plan,
excess cash held by Ridge Re was distributed
back to the Company (Refer to Note
19-Divestitures and Other Sales in the
Consolidated Financial Statements for further
information).
70


