Xerox 2007 Annual Report Download - page 137
Download and view the complete annual report
Please find page 137 of the 2007 Xerox annual report below. You can navigate through the pages in the report by either clicking on the pages listed below, or by using the keyword search tool below to find specific information within the annual report.-
 1
1 -
2
-
3
-
4
-
5
-
6
-
7
-
8
-
9
-
10
-
11
-
12
-
13
-
14
-
15
-
16
-
17
-
18
-
19
-
20
-
21
-
22
-
23
-
24
-
25
-
26
-
27
-
28
-
29
-
30
-
31
-
32
-
33
-
34
-
35
-
36
-
37
-
38
-
39
-
40
-
41
-
42
-
43
-
44
-
45
-
46
-
47
-
48
-
49
-
50
-
51
-
52
-
53
-
54
-
55
-
56
-
57
-
58
-
59
-
60
-
61
-
62
-
63
-
64
-
65
-
66
-
67
-
68
-
69
-
70
-
71
-
72
-
73
-
74
-
75
-
76
-
77
-
78
-
79
-
80
-
81
-
82
-
83
-
84
-
85
-
86
-
87
-
88
-
89
-
90
-
91
-
92
-
93
-
94
-
95
-
96
-
97
-
98
-
99
-
100
-
101
-
102
-
103
-
104
-
105
-
106
-
107
-
108
-
109
-
110
-
111
-
112
-
113
-
114
-
115
-
116
-
117
-
118
-
119
-
120
-
121
-
122
-
123
-
124
-
125
-
126
-
 127
127 -
 128
128 -
 129
129 -
 130
130 -
 131
131 -
 132
132 -
 133
133 -
 134
134 -
 135
135 -
 136
136 -
 137
137 -
 138
138 -
 139
139 -
 140
140
 |
 |

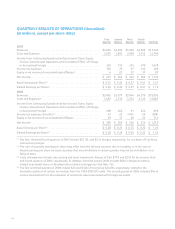
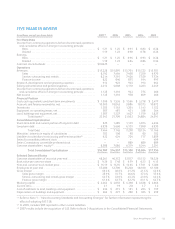
FIVE YEARS IN REVIEW
(in millions, except per-share data) 2007(3) 2006 2005 2004 2003
Per-Share Data
Income from continuing operations before discontinued operations
and cumulative effect of change in accounting principle
Basic ..................................................... $ 1.21 $ 1.25 $ 0.91 $ 0.84 $ 0.38
Diluted ................................................... 1.19 1.22 0.90 0.78 0.36
Earnings
Basic ..................................................... $ 1.21 $ 1.25 $ 0.96 $ 0.94 $ 0.38
Diluted ................................................... 1.19 1.22 0.94 0.86 0.36
Common stock dividends ....................................... $0.0425 ––––
Operations
Revenues ...................................................... $17,228 $15,895 $15,701 $15,722 $15,701
Sales ..................................................... 8,192 7,464 7,400 7,259 6,970
Service, outsourcing and rentals ............................. 8,214 7,591 7,426 7,529 7,734
Finance income ........................................... 822 840 875 934 997
Research, development and engineering expenses ................ 912 922 943 914 962
Selling, administrative and general expenses ..................... 4,312 4,008 4,110 4,203 4,249
Income from continuing operations before discontinued operations
and cumulative effect of change in accounting principle ......... 1,135 1,210 933 776 360
Net income .................................................... 1,135 1,210 978 859 360
Financial Position
Cash, cash equivalents and short-term investments ............... $ 1,099 $ 1,536 $ 1,566 $ 3,218 $ 2,477
Accounts and finance receivables, net ............................ 10,505 10,043 9,886 10,573 10,972
Inventories .................................................... 1,305 1,163 1,201 1,143 1,152
Equipment on operating leases, net .............................. 587 481 431 398 364
Land, buildings and equipment, net .............................. 1,587 1,527 1,627 1,759 1,827
Total Assets(1) ......................................... 23,543 21,709 21,953 24,884 24,591
Consolidated Capitalization
Short-term debt and current portion of long-term debt ............ 525 1,485 1,139 3,074 4,236
Long-term debt ................................................ 6,939 5,660 6,139 7,050 6,930
Total Debt ............................................ 7,464 7,145 7,278 10,124 11,166
Minorities’ interests in equity of subsidiaries ...................... 103 108 90 80 102
Liabilities to subsidiary trusts issuing preferred securities(2) ......... 632 624 724 717 1,809
Series B convertible preferred stock .............................. ––––499
Series C mandatory convertible preferred stock ................... – – 889 889 889
Common shareholders’ equity(1) ................................. 8,588 7,080 6,319 6,244 3,291
Total Consolidated Capitalization ..................... $16,787 $14,957 $15,300 $18,054 $17,756
Selected Data and Ratios
Common shareholders of record at year-end ...................... 48,261 40,372 53,017 55,152 56,326
Book value per common share ................................... $ 9.36 $ 7.48 $ 6.79 $ 6.53 $ 4.15
Year-end common stock market price ............................ $ 16.19 $ 16.95 $ 14.65 $ 17.01 $ 13.80
Employees at year-end ......................................... 57,400 53,700 55,220 58,100 61,100
Gross margin .................................................. 40.3% 40.6% 41.2% 41.6% 42.6%
Sales gross margin ......................................... 35.9% 35.7% 36.6% 37.4% 37.6%
Service, outsourcing and rentals gross margin ................ 42.7% 43.0% 43.3% 43.0% 44.3%
Finance gross margin ...................................... 61.6% 63.7% 62.7% 63.1% 63.7%
Working capital ................................................ $ 4,463 $ 4,056 $ 4,390 $ 4,628 $ 2,666
Current ratio ................................................... 2.1 1.9 2.0 1.7 1.4
Cost of additions to land, buildings and equipment ................ $ 236 $ 215 $ 181 $ 204 $ 197
Depreciation on buildings and equipment ........................ $ 262 $ 277 $ 280 $ 305 $ 299
(1) Refer to Note 1 – “New Accounting Standards and Accounting Changes” for further information representing the
effect of adopting FAS 158.
(2) In 2005, includes $98 reported in other current liabilities.
(3) 2007 results include the acquisition of GIS. Refer to Note 3-Acquisitions in the Consolidated Financial Statements.
Xerox Annual Report 2007 135