Xerox 2007 Annual Report Download - page 71
Download and view the complete annual report
Please find page 71 of the 2007 Xerox annual report below. You can navigate through the pages in the report by either clicking on the pages listed below, or by using the keyword search tool below to find specific information within the annual report.-
 1
1 -
2
-
3
-
4
-
5
-
6
-
7
-
8
-
9
-
10
-
11
-
12
-
13
-
14
-
15
-
16
-
17
-
18
-
19
-
20
-
21
-
22
-
23
-
24
-
25
-
26
-
27
-
28
-
29
-
30
-
31
-
32
-
33
-
34
-
35
-
36
-
37
-
38
-
39
-
40
-
41
-
42
-
43
-
44
-
45
-
46
-
47
-
48
-
49
-
50
-
51
-
52
-
53
-
54
-
55
-
56
-
57
-
58
-
59
-
60
-
 61
61 -
 62
62 -
 63
63 -
 64
64 -
 65
65 -
 66
66 -
 67
67 -
 68
68 -
 69
69 -
 70
70 -
 71
71 -
 72
72 -
 73
73 -
 74
74 -
 75
75 -
 76
76 -
 77
77 -
 78
78 -
 79
79 -
 80
80 -
 81
81 -
82
-
83
-
84
-
85
-
86
-
87
-
88
-
89
-
90
-
91
-
92
-
93
-
94
-
95
-
96
-
97
-
98
-
99
-
100
-
101
-
102
-
103
-
104
-
105
-
106
-
107
-
108
-
109
-
110
-
111
-
112
-
113
-
114
-
115
-
116
-
117
-
118
-
119
-
120
-
121
-
122
-
123
-
124
-
125
-
126
-
127
-
128
-
129
-
130
-
131
-
132
-
133
-
134
-
135
-
136
-
137
-
138
-
139
-
140
 |
 |

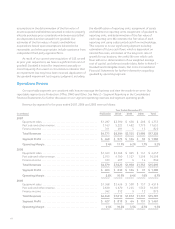
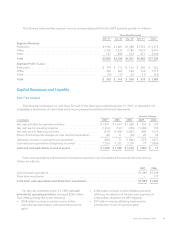
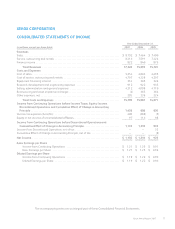
The following table provides segment revenue and operating profit for the 2007 quarterly periods (in millions):
Three Months Ended
Mar. 31 Jun. 30 Sep. 30 Dec. 31 Total
Segment Revenue:
Production ....................................................... $1,194 $1,281 $1,286 $1,554 $ 5,315
Office ........................................................... 2,105 2,327 2,384 2,657 9,473
Other ............................................................ 537 600 632 671 2,440
Total $3,836 $4,208 $4,302 $4,882 $17,228
Segment Profit / (Loss):
Production ....................................................... $ 119 $ 111 $ 126 $ 206 $ 562
Office ........................................................... 259 267 259 330 1,115
Other ............................................................ (16) (31) (25) (17) (89)
Total $ 362 $ 347 $ 360 $ 519 $ 1,588
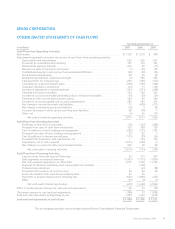
Capital Resources and Liquidity
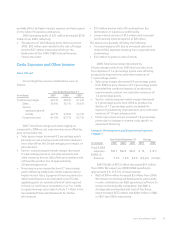
Cash Flow Analysis
The following summarizes our cash flows for each of the three years ended December 31, 2007, as reported in our
Consolidated Statements of Cash Flows in the accompanying Consolidated Financial Statements:
Amount Change
(in millions) 2007 2006 2005 2007 2006
Net cash provided by operating activities ......................... $1,871 $ 1,617 $ 1,420 $ 254 $ 197
Net cash used in investing activities .............................. (1,612) (143) (295) (1,469) 152
Net cash used in financing activities .............................. (619) (1,428) (2,962) 809 1,534
Effect of exchange rate changes on cash and cash equivalents ...... 60 31 (59) 29 90
(Decrease) increase in cash and cash equivalents .................. (300) 77 (1,896) (377) 1,973
Cash and cash equivalents at beginning of period ................. 1,399 1,322 3,218 77 (1,896)
Cash and cash equivalents at end of period ..................... $ 1,099 $ 1,399 $ 1,322 $ (300) $ 77
Cash, cash equivalents and Short-term investments reported in our Consolidated Financial Statements were as
follows (in millions):
2007 2006
Cash and cash equivalents ..................................................................... $1,099 $1,399
Short-term investments ....................................................................... – 137
Total Cash, cash equivalents and Short-term investments ...................................... $1,099 $1,536
For the year ended December 31, 2007, net cash
provided by operating activities, increased $254 million
from 2006 primarily due to the following:
• $348 million increase in pre tax income before
restructuring, depreciation, other provisions and net
gains.
• $108 million increase in other liabilities primarily
reflecting the absence of the prior year payment of
$106 million related to the MPI litigation.
• $57 million increase reflecting lower pension
contributions to our U.S. pension plans.
Xerox Annual Report 2007 69