Xerox 2007 Annual Report Download - page 57
Download and view the complete annual report
Please find page 57 of the 2007 Xerox annual report below. You can navigate through the pages in the report by either clicking on the pages listed below, or by using the keyword search tool below to find specific information within the annual report.-
 1
1 -
2
-
3
-
4
-
5
-
6
-
7
-
8
-
9
-
10
-
11
-
12
-
13
-
14
-
15
-
16
-
17
-
18
-
19
-
20
-
21
-
22
-
23
-
24
-
25
-
26
-
27
-
28
-
29
-
30
-
31
-
32
-
33
-
34
-
35
-
36
-
37
-
38
-
39
-
40
-
41
-
42
-
43
-
44
-
45
-
46
-
 47
47 -
 48
48 -
 49
49 -
 50
50 -
 51
51 -
 52
52 -
 53
53 -
 54
54 -
 55
55 -
 56
56 -
 57
57 -
 58
58 -
 59
59 -
 60
60 -
 61
61 -
 62
62 -
 63
63 -
 64
64 -
 65
65 -
 66
66 -
 67
67 -
68
-
69
-
70
-
71
-
72
-
73
-
74
-
75
-
76
-
77
-
78
-
79
-
80
-
81
-
82
-
83
-
84
-
85
-
86
-
87
-
88
-
89
-
90
-
91
-
92
-
93
-
94
-
95
-
96
-
97
-
98
-
99
-
100
-
101
-
102
-
103
-
104
-
105
-
106
-
107
-
108
-
109
-
110
-
111
-
112
-
113
-
114
-
115
-
116
-
117
-
118
-
119
-
120
-
121
-
122
-
123
-
124
-
125
-
126
-
127
-
128
-
129
-
130
-
131
-
132
-
133
-
134
-
135
-
136
-
137
-
138
-
139
-
140
 |
 |

• 16% growth in color post sale and other revenue.
Color sales represented 31% of post sale and other
revenue in 2006 compared to 28% in 2005. In
2006, approximately 9% of our pages were
printed on color devices, which was up from 7% in
2005.
• 9% growth in color equipment sales revenue. The
pace of color equipment sales growth was
impacted by lower OEM color printer sales. Color
sales represented approximately 45% of total
equipment sales in 2006 compared to 41% in
2005.
(1) Post sale revenue is largely a function of the equipment
placed at customer locations, the volume of prints and
copies that our customers make on that equipment, the
mix of color pages, as well as associated services.
(2) Color revenues represent a subset of total revenues and
excludes the impact of GIS.
(3) The percentage point impacts from GIS reflect the
revenue growth year-over-year after including GIS’
results from 2006 on a proforma basis. See page 76 for
an explanation of this non-GAAP measure.
(4) As of December 31, 2007, total color, color post sale,
financing and other, and color equipment sales
revenues comprised 37%, 34% and 46%, respectively,
if calculated on total, total post sale, financing and
other, and total equipment sales revenues, including
GIS. GIS is excluded from the color information
presented, as the breakout of the information required
to make this computation for all periods is not available.
2008 Projected Revenues
Excluding currency impacts, we expect 2008 revenue
to grow moderately driven by continued increases in
annuity revenue. We anticipate that new launches
combined with products and applications launched during
the prior two years, and the businesses acquired in 2007,
will enable us to further strengthen our market position.
Growth in post sale and other revenue will be driven
by our success in increasing the volume of equipment
installed at customer locations, volume of pages and mix
of color pages generated on that equipment, as well as
growth in document management services.
Net Income
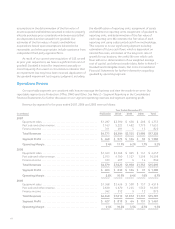
Net income and diluted earnings per share for the three years ended December 31, 2007 were as follows:
(in millions, except per share amounts) 2007 2006 2005
Net income ........................................................................... $1,135 $1,210 $ 978
Diluted earnings per share ............................................................. $ 1.19 $ 1.22 $0.94
2007 Net income of $1,135 million, or $1.19 per
diluted share, decreased $75 million or $0.03 per diluted
share from 2006 primarily reflecting:
• Gross profit increase of $492 million due to increased
revenue of $1,333 million, including the addition of
GIS.
• Increase in selling, administrative and general
expenses of $304 million due primarily to the inclusion
of GIS.
• Decrease in restructuring and asset impairment
charges of $391 million. 2006 restructuring charges
were $385 million ($257 million after-tax).
• Decrease in Other expenses, net of $41 million due to
2006 charges of $68 million (pre and post tax) related
to probable losses for Brazilian labor-related
contingencies and a $13 million ($9 million after-tax)
charge resulting from the termination of a previous
credit facility.
• Increase in income tax expense of $688 million due to
higher pre-tax income as well as the absence of the
following 2006 income tax benefits:
• $472 million related to the favorable resolution of
certain tax matters from the 1999-2003 IRS audit.
• $46 million tax benefit resulting from the
resolution of certain tax matters associated with
foreign tax audits.
• Decrease in equity income of $17 million primarily
attributable to charges of $30 million for our share of
Fuji Xerox restructuring.
2006 Net income of $1,210 million, or $1.22 per
diluted share, increased $232 million or $0.28 per diluted
share from 2005 primarily reflecting:
• $472 million income tax benefit related to the
favorable resolution of certain tax matters from the
1999-2003 IRS audit.
Xerox Annual Report 2007 55