Xerox 2007 Annual Report Download - page 65
Download and view the complete annual report
Please find page 65 of the 2007 Xerox annual report below. You can navigate through the pages in the report by either clicking on the pages listed below, or by using the keyword search tool below to find specific information within the annual report.-
 1
1 -
2
-
3
-
4
-
5
-
6
-
7
-
8
-
9
-
10
-
11
-
12
-
13
-
14
-
15
-
16
-
17
-
18
-
19
-
20
-
21
-
22
-
23
-
24
-
25
-
26
-
27
-
28
-
29
-
30
-
31
-
32
-
33
-
34
-
35
-
36
-
37
-
38
-
39
-
40
-
41
-
42
-
43
-
44
-
45
-
46
-
47
-
48
-
49
-
50
-
51
-
52
-
53
-
54
-
 55
55 -
 56
56 -
 57
57 -
 58
58 -
 59
59 -
 60
60 -
 61
61 -
 62
62 -
 63
63 -
 64
64 -
 65
65 -
 66
66 -
 67
67 -
 68
68 -
 69
69 -
 70
70 -
 71
71 -
 72
72 -
 73
73 -
 74
74 -
 75
75 -
76
-
77
-
78
-
79
-
80
-
81
-
82
-
83
-
84
-
85
-
86
-
87
-
88
-
89
-
90
-
91
-
92
-
93
-
94
-
95
-
96
-
97
-
98
-
99
-
100
-
101
-
102
-
103
-
104
-
105
-
106
-
107
-
108
-
109
-
110
-
111
-
112
-
113
-
114
-
115
-
116
-
117
-
118
-
119
-
120
-
121
-
122
-
123
-
124
-
125
-
126
-
127
-
128
-
129
-
130
-
131
-
132
-
133
-
134
-
135
-
136
-
137
-
138
-
139
-
140
 |
 |

partially offset by higher interest expense and lower gains
on the sales of businesses and assets.
2006 Operating profit of $31 million decreased $120
million from 2005, reflecting:
• The absence of the following items that occurred in
2005: $93 million gain related to the sale of Integic
and the $57 million interest benefit from the
finalization of the 1996-1998 Internal Revenue
Service tax audit.
• $13 million pre-tax write-off resulting from the
termination of a previous credit facility.
• Lower interest income of $12 million and increased
non-financing interest expense of $8 million.
The above were partially offset by the following:
• Increased paper profit due to increased sales and
reduced SAG expenses resulting from organizational
streamlining.
• $44 million in gains on sale of assets.
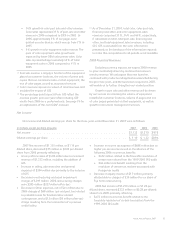
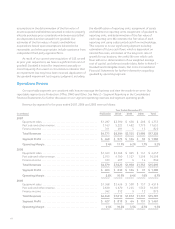
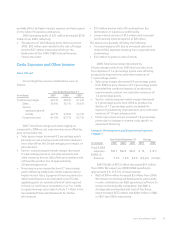
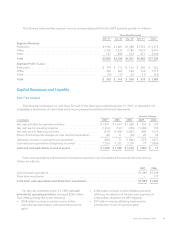
Costs, Expenses and Other Income
Gross Margin
Gross margins by revenue classification were as
follows:
Year Ended December 31,
(in millions) 2007 2006 2005
Total Gross margin .... 40.3% 40.6% 41.2%
Sales ............. 35.9% 35.7% 36.6%
Service,
outsourcing and
rentals ......... 42.7% 43.0% 43.3%
Finance income . . . 61.6% 63.7% 62.7%
2007 Total Gross margin was down slightly as
compared to 2006 as cost improvements were offset by
price and product mix.
• Sales gross margin increased 0.2-percentage points
primarily as cost improvements and other variances
more than offset the 2.0-percentage point impact of
price declines.
• Service, outsourcing and rentals margin decreased
0.3-percentage points as cost improvements and
other variances did not fully offset price declines and
unfavorable product mix of approximately
2.0-percentage points.
• Financing income margin declined 2.1-percentage
points reflecting additional interest expense due to
higher interest rates. Equipment financing interest is
determined based on an estimated cost of funds,
applied against an estimated level of debt required
to fund our net finance receivables on a 7 to 1 debt
to equity leverage ratio (refer to Note 11- Debt in the
Consolidated Financial Statements for further
information).
2006 Total Gross margin decreased by
0.6-percentage points from 2005 due to product mix.
Price declines of 1.4-percentage points were offset by
productivity improvements and other variances of
1.4-percentage points.
• Sales gross margin decreased 0.9-percentage points
from 2005 as price declines of 2.1-percentage points
exceeded the combined impacts of productivity
improvements, product mix and other variances of
1.2-percentage points.
• Service, outsourcing and rentals margin decreased
0.3-percentage points from 2005 as product mix
decline of 1.3-percentage points exceeded the
impact of productivity improvements, price and other
variances of 1.0-percentage points.
• Financing income margin increased 1.0-percentage
points due to changes in interest costs specific to
equipment financing.
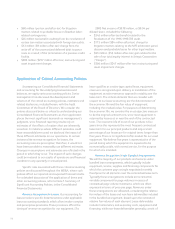
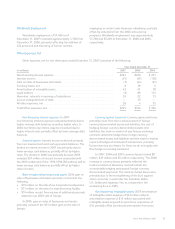
Research, Development and Engineering Expenses
(“R,D&E”)
(in millions)
Year Ended December 31, Change
2007 2006 2005 2007 2006
Total R,D&E
expenses . . $912 $922 $943 $ 10 $ (21)
R,D&E %
Revenue . . . 5.3% 5.8% 6.0% (0.5)pts (0.2)pts
2007 R,D&E of $912 million decreased $10 million
from 2006. We expect our 2008 R,D&E spending to
approximate 5% to 5.5% of total revenue.
• R&D of $764 million increased $3 million from 2006.
We invest in technological development, particularly
in color, and believe our R&D spending is sufficient to
remain technologically competitive. Our R&D is
strategically coordinated with that of Fuji Xerox,
which invested $672 million and $660 million in R&D
in 2007 and 2006, respectively.
Xerox Annual Report 2007 63