Xerox 2007 Annual Report Download - page 112
Download and view the complete annual report
Please find page 112 of the 2007 Xerox annual report below. You can navigate through the pages in the report by either clicking on the pages listed below, or by using the keyword search tool below to find specific information within the annual report.-
 1
1 -
2
-
3
-
4
-
5
-
6
-
7
-
8
-
9
-
10
-
11
-
12
-
13
-
14
-
15
-
16
-
17
-
18
-
19
-
20
-
21
-
22
-
23
-
24
-
25
-
26
-
27
-
28
-
29
-
30
-
31
-
32
-
33
-
34
-
35
-
36
-
37
-
38
-
39
-
40
-
41
-
42
-
43
-
44
-
45
-
46
-
47
-
48
-
49
-
50
-
51
-
52
-
53
-
54
-
55
-
56
-
57
-
58
-
59
-
60
-
61
-
62
-
63
-
64
-
65
-
66
-
67
-
68
-
69
-
70
-
71
-
72
-
73
-
74
-
75
-
76
-
77
-
78
-
79
-
80
-
81
-
82
-
83
-
84
-
85
-
86
-
87
-
88
-
89
-
90
-
91
-
92
-
93
-
94
-
95
-
96
-
97
-
98
-
99
-
100
-
101
-
 102
102 -
 103
103 -
 104
104 -
 105
105 -
 106
106 -
 107
107 -
 108
108 -
 109
109 -
 110
110 -
 111
111 -
 112
112 -
 113
113 -
 114
114 -
 115
115 -
 116
116 -
 117
117 -
 118
118 -
 119
119 -
 120
120 -
 121
121 -
 122
122 -
123
-
124
-
125
-
126
-
127
-
128
-
129
-
130
-
131
-
132
-
133
-
134
-
135
-
136
-
137
-
138
-
139
-
140
 |
 |

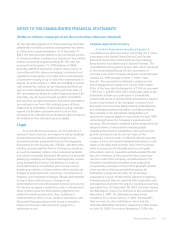
NOTES TO THE CONSOLIDATED FINANCIAL STATEMENTS
(Dollars in millions, except per-share data and unless otherwise indicated)
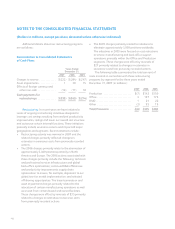
At December 31, 2006, we had outstanding Japanese
Yen/USD cross-currency interest rate swap agreements
with aggregate notional amounts of $126 and a net
liability fair value of $9. These contracts matured during
2007 together with the scheduled repayment of the
related debt. No such contracts were outstanding at
December 31, 2007.
Cash Flow Hedges:
Debt related: As of December 31, 2006, our cross
currency interest rate swaps were used to hedge the
currency exposure for interest payments and principal on
half of our Japanese Yen denominated debt of ¥30 billion
(U.S. $252). In addition, certain forward currency
contracts were used to hedge the currency exposure for
interest payments on the remaining Yen debt. These
combined strategies converted the hedged cash flows on
our Japanese Yen denominated debt to U.S. dollars and
qualified for cash flow hedge accounting. The derivatives
matured during 2007 together with the scheduled
repayment of the related debt.
No amount of ineffectiveness was recorded in the
Consolidated Statements of Income for the three years
ended December 31, 2007 for these designated cash flow
hedges and all components of each derivative’s gain or
loss was included in the assessment of hedge
effectiveness.
Inventory purchases: During 2007 we began to
designate some of our foreign currency derivative
contracts as cash flow hedges for a portion of our
foreign currency denominated inventory purchases.
The changes in fair value for these contracts were
reported in AOCL and reclassified to Cost of Sales in the
period or periods during which the related inventory
was sold. No amount of ineffectiveness was recorded in
the Consolidated Statements of Income for these
designated cash flow hedges and all components of
each derivative’s gain or loss was included in the
assessment of hedge effectiveness. As of December 31,
2007, there were no contracts outstanding.
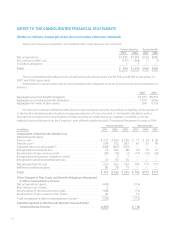
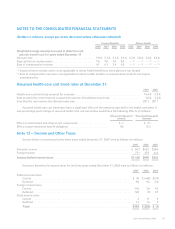
Accumulated Other Comprehensive Loss
(“AOCL”): The following table provides a summary of
the activity associated with all of our designated cash
flow hedges (interest rate and foreign currency)
reflected in AOCL for the three years ended
December 31, 2007:
Years ended
December 31,
2007 2006 2005
Net Gain/(Loss):
Beginning balance, net of tax ...... $ 1 $1 $ 3
Changes in fair value .............. 4 (1) (32)
Reclass to earnings ................ (5) 1 30
Ending balance, net of tax ...... $– $1 $ 1
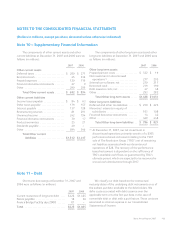
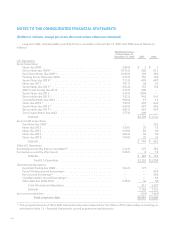
Fair Value of Financial Instruments: The estimated fair values of our financial instruments at December 31, 2007
and 2006 were as follows:
2007 2006
(in millions) Carrying
Amount Fair
Value Carrying
Amount Fair
Value
Cash and cash equivalents .................................................. $1,099 $1,099 $1,399 $1,399
Short-term investments ..................................................... – – 137 137
Accounts receivable, net .................................................... 2,457 2,457 2,199 2,199
Short-term debt ............................................................ 525 525 1,485 1,487
Long-term debt ............................................................ 6,939 7,176 5,660 5,917
Liability to subsidiary trust issuing preferred securities ......................... 632 632 624 640
The fair value amounts for Cash and cash equivalents
and Accounts receivable, net approximate carrying
amounts due to the short maturities of these instruments.
The fair value of Short and Long-term debt, as well as our
Liability to subsidiary trust issuing preferred securities, was
estimated based on quoted market prices for publicly
traded securities or on the current rates offered to us for
debt of similar maturities. The difference between the fair
value and the carrying value represents the theoretical net
premium or discount we would pay or receive to retire all
debt at such date.
110