Xerox 2007 Annual Report Download - page 116
Download and view the complete annual report
Please find page 116 of the 2007 Xerox annual report below. You can navigate through the pages in the report by either clicking on the pages listed below, or by using the keyword search tool below to find specific information within the annual report.-
 1
1 -
2
-
3
-
4
-
5
-
6
-
7
-
8
-
9
-
10
-
11
-
12
-
13
-
14
-
15
-
16
-
17
-
18
-
19
-
20
-
21
-
22
-
23
-
24
-
25
-
26
-
27
-
28
-
29
-
30
-
31
-
32
-
33
-
34
-
35
-
36
-
37
-
38
-
39
-
40
-
41
-
42
-
43
-
44
-
45
-
46
-
47
-
48
-
49
-
50
-
51
-
52
-
53
-
54
-
55
-
56
-
57
-
58
-
59
-
60
-
61
-
62
-
63
-
64
-
65
-
66
-
67
-
68
-
69
-
70
-
71
-
72
-
73
-
74
-
75
-
76
-
77
-
78
-
79
-
80
-
81
-
82
-
83
-
84
-
85
-
86
-
87
-
88
-
89
-
90
-
91
-
92
-
93
-
94
-
95
-
96
-
97
-
98
-
99
-
100
-
101
-
102
-
103
-
104
-
105
-
 106
106 -
 107
107 -
 108
108 -
 109
109 -
 110
110 -
 111
111 -
 112
112 -
 113
113 -
 114
114 -
 115
115 -
 116
116 -
 117
117 -
 118
118 -
 119
119 -
 120
120 -
 121
121 -
 122
122 -
 123
123 -
 124
124 -
 125
125 -
 126
126 -
127
-
128
-
129
-
130
-
131
-
132
-
133
-
134
-
135
-
136
-
137
-
138
-
139
-
140
 |
 |

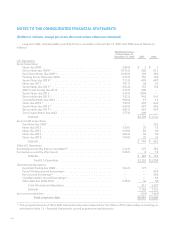
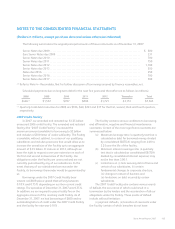
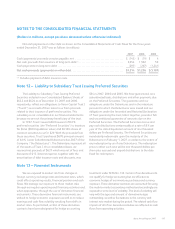
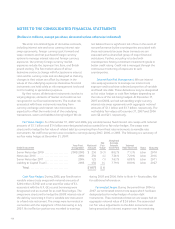
NOTES TO THE CONSOLIDATED FINANCIAL STATEMENTS
(Dollars in millions, except per-share data and unless otherwise indicated)
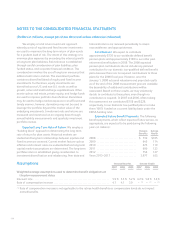
We employ a total return investment approach
whereby a mix of equities and fixed income investments
are used to maximize the long-term return of plan assets
for a prudent level of risk. The intent of this strategy is to
minimize plan expenses by exceeding the interest growth
in long-term plan liabilities. Risk tolerance is established
through careful consideration of plan liabilities, plan
funded status, and corporate financial condition. This
consideration involves the use of long-term measures that
address both return and risk. The investment portfolio
contains a diversified blend of equity and fixed income
investments. Furthermore, equity investments are
diversified across U.S. and non-U.S. stocks as well as
growth, value and small and large capitalizations. Other
assets such as real estate, private equity, and hedge funds
are used to improve portfolio diversification. Derivatives
may be used to hedge market exposure in an efficient and
timely manner; however, derivatives may not be used to
leverage the portfolio beyond the market value of the
underlying investments. Investment risks and returns are
measured and monitored on an ongoing basis through
annual liability measurements and quarterly investment
portfolio reviews.
Expected Long Term Rate of Return: We employ a
“building block” approach in determining the long-term
rate of return for plan assets. Historical markets are
studied and long-term relationships between equities and
fixed income are assessed. Current market factors such as
inflation and interest rates are evaluated before long-term
capital market assumptions are determined. The long-term
portfolio return is established giving consideration to
investment diversification and rebalancing. Peer data and
historical returns are reviewed periodically to assess
reasonableness and appropriateness.
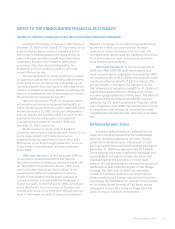
Contributions: We expect to contribute
approximately $130 to our worldwide defined benefit
pension plans and approximately $100 to our other post
retirement benefit plans in 2008. The 2008 expected
pension plan contributions do not include any planned
contribution for our domestic tax-qualified defined benefit
plans because there are no required contributions to these
plans for the 2008 fiscal year. However, once the
January 1, 2008 actuarial valuations and projected results
as of the end of the 2008 measurement year are available,
the desirability of additional contributions will be
reassessed. Based on these results, we may voluntarily
decide to contribute to these plans, even though no
contribution is required. In 2007 and 2006, after making
this assessment, we contributed $158 and $228,
respectively, to our domestic tax qualified plans to make
them 100% funded on a current liability basis under the
ERISA funding rules.
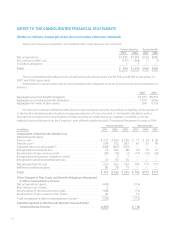
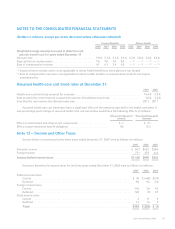
Estimated Future Benefit Payments: The following
benefit payments, which reflect expected future service, as
appropriate, are expected to be paid during the following
years (in millions):
Pension
Benefits Retiree
Health
2008 ............................... $ 732 $105
2009 ............................... 645 114
2010 ............................... 675 119
2011 ............................... 690 123
2012 ............................... 758 127
Years 2013–2017 .................... 3,977 635
Assumptions Pension Benefits Retiree Health
2007 2006 2005 2007 2006 2005
Weighted-average assumptions used to determine benefit obligations at
the plan measurement dates
Discount rate ............................................................ 5.9% 5.3% 5.2% 6.2% 5.8% 5.6%
Rate of compensation increase ............................................ 4.1 4.1 3.9 – (1) –(1) –(1)
(1) Rate of compensation increase is not applicable to the retiree health benefits as compensation levels do not impact
earned benefits.
114