Xerox 2007 Annual Report Download - page 55
Download and view the complete annual report
Please find page 55 of the 2007 Xerox annual report below. You can navigate through the pages in the report by either clicking on the pages listed below, or by using the keyword search tool below to find specific information within the annual report.-
 1
1 -
2
-
3
-
4
-
5
-
6
-
7
-
8
-
9
-
10
-
11
-
12
-
13
-
14
-
15
-
16
-
17
-
18
-
19
-
20
-
21
-
22
-
23
-
24
-
25
-
26
-
27
-
28
-
29
-
30
-
31
-
32
-
33
-
34
-
35
-
36
-
37
-
38
-
39
-
40
-
41
-
42
-
43
-
44
-
 45
45 -
 46
46 -
 47
47 -
 48
48 -
 49
49 -
 50
50 -
 51
51 -
 52
52 -
 53
53 -
 54
54 -
 55
55 -
 56
56 -
 57
57 -
 58
58 -
 59
59 -
 60
60 -
 61
61 -
 62
62 -
 63
63 -
 64
64 -
 65
65 -
66
-
67
-
68
-
69
-
70
-
71
-
72
-
73
-
74
-
75
-
76
-
77
-
78
-
79
-
80
-
81
-
82
-
83
-
84
-
85
-
86
-
87
-
88
-
89
-
90
-
91
-
92
-
93
-
94
-
95
-
96
-
97
-
98
-
99
-
100
-
101
-
102
-
103
-
104
-
105
-
106
-
107
-
108
-
109
-
110
-
111
-
112
-
113
-
114
-
115
-
116
-
117
-
118
-
119
-
120
-
121
-
122
-
123
-
124
-
125
-
126
-
127
-
128
-
129
-
130
-
131
-
132
-
133
-
134
-
135
-
136
-
137
-
138
-
139
-
140
 |
 |

2007 gross margins of 40.3% were slightly below
prior year as cost improvements were offset by product
mix and pricing. Selling, administrative and general
(“SAG”) expense as a percent of revenue was 0.2-
percentage points lower year over year. SAG expenses
grew as the inclusion of GIS and unfavorable currency
offset the benefits of prior restructuring. Additionally, we
continued to invest in research and development and to
prioritize our investments to the faster growing areas of
the market.
Our balance sheet strategy focused on optimizing
operating cash flows and returning value to shareholders
through acquisitions, share repurchase and dividends. We
continue to maintain debt levels primarily to support our
customer financing operations as debt associated with our
acquisition of GIS was effectively repaid by year-end. We
also continued our strategy to replace debt secured by our
finance receivables with new unsecured debt, reducing the
percentage of secured debt to total debt to a modest 4%.
The successful implementation of this strategy enabled us
to significantly strengthen our balance sheet and led to
our third investment grade credit rating, thereby
completing the transition to a high-grade credit.
We finished the year with a cash and cash
equivalents balance of $1.1 billion. Our prospective
balance sheet strategy includes: optimizing operating cash
flows, maintaining our investment grade credit ratings,
achieving an optimal cost of capital and effectively
deploying cash to deliver and maximize long-term
shareholder value. Our strategy also includes maintaining
an appropriate leverage of our financing assets (finance
receivables and equipment on operating leases) and an
appropriate level of non-financing debt.
During 2007 we declared our first quarterly dividend
in six years. A dividend of 4.25 cents per share was paid on
January 31, 2008 to shareholders of record on
December 31, 2007. The dividend declaration underscores
our confidence in our business model and the health of
our business, which is the foundation for our strong
financial position.
Currency Impacts
To understand the trends in the business, we believe
that it is helpful to analyze the impact of changes in the
translation of foreign currencies into U.S. dollars on
revenues and expenses. We refer to this analysis as
“currency impact” or “the impact from currency”. Revenues
and expenses from our Developing Markets Operations
(“DMO”) are analyzed at actual exchange rates for all
periods presented, since these countries generally have
volatile currency and inflationary environments, and our
operations in these countries have historically
implemented pricing actions to recover the impact of
inflation and devaluation. We do not hedge the
translation effect of revenues or expenses denominated in
currencies where the local currency is the functional
currency.
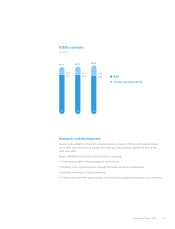
Approximately 50% of our consolidated revenues are
derived from operations outside of the United States
where the U.S. dollar is not the functional currency. When
compared with the average of the major European
currencies on a revenue-weighted basis, the U.S. dollar was
9% weaker in 2007 and unchanged in 2006 and 2005. As
a result, the foreign currency translation impact on
revenue was a 3% benefit in 2007 and negligible in 2006.
Summary Results
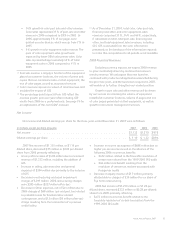
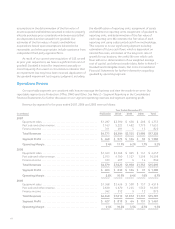
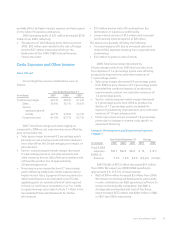
Revenues
Revenues for the three years ended December 31, 2007 were as follows:
(in millions)
Year Ended December 31, Percent Change
2007 2006 2005 2007 2006
Equipment sales ................................................... $ 4,753 $ 4,457 $ 4,519 7% (1)%
Post sale and other revenue(1) ...................................... 11,653 10,598 10,307 10% 3%
Finance income ................................................... 822 840 875 (2)% (4)%
Total Revenue .................................................... $17,228 $15,895 $15,701 8% 1%
Xerox Annual Report 2007 53