Xerox 2007 Annual Report Download - page 62
Download and view the complete annual report
Please find page 62 of the 2007 Xerox annual report below. You can navigate through the pages in the report by either clicking on the pages listed below, or by using the keyword search tool below to find specific information within the annual report.-
 1
1 -
2
-
3
-
4
-
5
-
6
-
7
-
8
-
9
-
10
-
11
-
12
-
13
-
14
-
15
-
16
-
17
-
18
-
19
-
20
-
21
-
22
-
23
-
24
-
25
-
26
-
27
-
28
-
29
-
30
-
31
-
32
-
33
-
34
-
35
-
36
-
37
-
38
-
39
-
40
-
41
-
42
-
43
-
44
-
45
-
46
-
47
-
48
-
49
-
50
-
51
-
 52
52 -
 53
53 -
 54
54 -
 55
55 -
 56
56 -
 57
57 -
 58
58 -
 59
59 -
 60
60 -
 61
61 -
 62
62 -
 63
63 -
 64
64 -
 65
65 -
 66
66 -
 67
67 -
 68
68 -
 69
69 -
 70
70 -
 71
71 -
 72
72 -
73
-
74
-
75
-
76
-
77
-
78
-
79
-
80
-
81
-
82
-
83
-
84
-
85
-
86
-
87
-
88
-
89
-
90
-
91
-
92
-
93
-
94
-
95
-
96
-
97
-
98
-
99
-
100
-
101
-
102
-
103
-
104
-
105
-
106
-
107
-
108
-
109
-
110
-
111
-
112
-
113
-
114
-
115
-
116
-
117
-
118
-
119
-
120
-
121
-
122
-
123
-
124
-
125
-
126
-
127
-
128
-
129
-
130
-
131
-
132
-
133
-
134
-
135
-
136
-
137
-
138
-
139
-
140
 |
 |

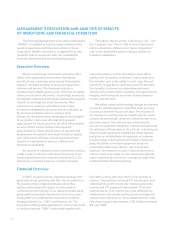
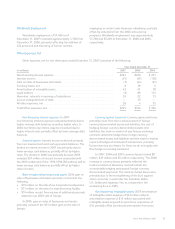
assumptions in the determination of the fair value of
assets acquired and liabilities assumed in order to properly
allocate purchase price consideration between assets that
are depreciated and amortized from goodwill. Our
estimates of the fair values of assets and liabilities
acquired are based upon assumptions believed to be
reasonable, and when appropriate, include assistance from
independent third-party appraisal firms.
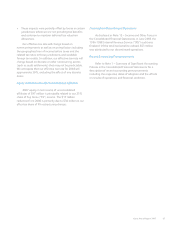
As result of our current year acquisition of GIS, as well
as prior year acquisitions, we have a significant amount of
goodwill. Goodwill is tested for impairment annually or
more frequently if an event or circumstance indicates that
an impairment loss may have been incurred. Application of
the goodwill impairment test requires judgment, including
the identification of reporting units, assignment of assets
and liabilities to reporting units, assignment of goodwill to
reporting units, and determination of the fair value of
each reporting unit. We estimate the fair value of each
reporting unit using a discounted cash flow methodology.
This requires us to use significant judgment including
estimation of future cash flows, which is dependent on
internal forecasts, estimation of the long-term rate of
growth for our business, the useful life over which cash
flows will occur, determination of our weighted average
cost of capital, and relevant market data. Refer to Note 8 –
Goodwill and Intangible Assets, Net in the Consolidated
Financial Statements for further information regarding
goodwill by operating segment.
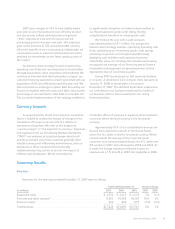
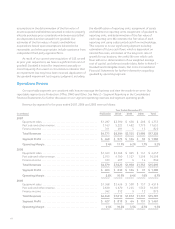
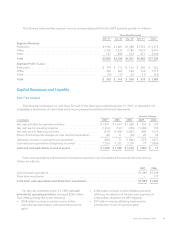
Operations Review
Our reportable segments are consistent with how we manage the business and view the markets we serve. Our
reportable segments are Production, Office, DMO and Other. See Note 2 – Segment Reporting in the Consolidated
Financial Statements for further discussion on our segment operating revenues and segment operating profit.
Revenue by segment for the years ended 2007, 2006 and 2005 were as follows:
Year Ended December 31,
(in millions) Production Office DMO Other Total
2007
Equipment sales ........................................... $1,297 $2,590 $ 658 $ 208 $ 4,753
Post sale and other revenue ................................. 3,163 5,223 1,492 1,775 11,653
Finance income ............................................ 311 491 5 15 822
Total Revenues ........................................... $4,771 $8,304 $2,155 $1,998 $17,228
Segment Profit ............................................ $ 448 $ 973 $ 134 $ 33 $ 1,588
Operating Margin ......................................... 9.4% 11.7% 6.2% 1.7% 9.2%
2006
Equipment sales ........................................... $1,343 $2,368 $ 605 $ 141 $ 4,457
Post sale and other revenue ................................. 2,913 4,760 1,327 1,598 10,598
Finance income ............................................ 323 497 6 14 840
Total Revenues ........................................... $4,579 $7,625 $1,938 $1,753 $15,895
Segment Profit ............................................ $ 403 $ 832 $ 124 $ 31 $ 1,390
Operating Margin ......................................... 8.8% 10.9% 6.4% 1.8% 8.7%
2005
Equipment sales ........................................... $1,368 $2,436 $ 558 $ 157 $ 4,519
Post sale and other revenue ................................. 2,830 4,670 1,245 1,562 10,307
Finance income ............................................ 342 512 9 12 875
Total Revenues ........................................... $4,540 $7,618 $1,812 $1,731 $15,701
Segment Profit ............................................ $ 427 $ 819 $ 64 $ 151 $ 1,461
Operating Margin ......................................... 9.4% 10.8% 3.5% 8.7% 9.3%
60