Xerox 2007 Annual Report Download - page 66
Download and view the complete annual report
Please find page 66 of the 2007 Xerox annual report below. You can navigate through the pages in the report by either clicking on the pages listed below, or by using the keyword search tool below to find specific information within the annual report.-
 1
1 -
2
-
3
-
4
-
5
-
6
-
7
-
8
-
9
-
10
-
11
-
12
-
13
-
14
-
15
-
16
-
17
-
18
-
19
-
20
-
21
-
22
-
23
-
24
-
25
-
26
-
27
-
28
-
29
-
30
-
31
-
32
-
33
-
34
-
35
-
36
-
37
-
38
-
39
-
40
-
41
-
42
-
43
-
44
-
45
-
46
-
47
-
48
-
49
-
50
-
51
-
52
-
53
-
54
-
55
-
 56
56 -
 57
57 -
 58
58 -
 59
59 -
 60
60 -
 61
61 -
 62
62 -
 63
63 -
 64
64 -
 65
65 -
 66
66 -
 67
67 -
 68
68 -
 69
69 -
 70
70 -
 71
71 -
 72
72 -
 73
73 -
 74
74 -
 75
75 -
 76
76 -
77
-
78
-
79
-
80
-
81
-
82
-
83
-
84
-
85
-
86
-
87
-
88
-
89
-
90
-
91
-
92
-
93
-
94
-
95
-
96
-
97
-
98
-
99
-
100
-
101
-
102
-
103
-
104
-
105
-
106
-
107
-
108
-
109
-
110
-
111
-
112
-
113
-
114
-
115
-
116
-
117
-
118
-
119
-
120
-
121
-
122
-
123
-
124
-
125
-
126
-
127
-
128
-
129
-
130
-
131
-
132
-
133
-
134
-
135
-
136
-
137
-
138
-
139
-
140
 |
 |

• Sustaining engineering costs of $148 million were $13
lower than 2006 due primarily to lower spending
related to environmental compliance activities and
maturing product platforms in the Production
segment.
• R,D&E as a percentage of revenue declined
0.5-percentage points as we leveraged our current
R,D&E investments to support GIS operations.
2006 R,D&E of $922 million decreased $21 million
from 2005 reflecting lower environmental compliance
spending.
• R&D of $761 million increased $6 million from 2005
reflecting higher expenditures in the Production and
Office segments primarily related to expected 2007
product launches.
• Sustaining engineering costs of $161 million
decreased $27 million from 2005, reflecting lower
spending related to environmental compliance
activities and maturing product platforms.
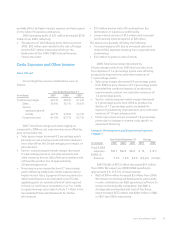
Selling, Administrative and General Expenses (“SAG”)
Year Ended
December 31, Amount
Change
2007 2006 2005 2007 2006
Total SAG
expenses . . . $4,312 $4,008 $4,110 $304 $(102)
SAG as a % of
revenue .... 25.0% 25.2% 26.2% (0.2)pts (1.0)pts
2007 SAG expenses of $4,312 million were higher
than 2006, including a $141 million negative impact from
currency. The SAG expense increase was the result of the
following:
• $93 million increase in selling expenses primarily
reflecting the negative impact from currency and the
inclusion of GIS. This increase was partially offset by
lower costs reflecting the benefits from the 2006
restructuring programs intended to realign our sales
infrastructure.
• $164 million increase in general and administrative
(“G&A”) expenses primarily from the inclusion of GIS,
unfavorable currency and information technology
investments.
• $47 million increase in bad debt expense primarily as a
result of an increase in reserves for several customers
in Europe as well as a 2006 reduction in expense due
to adjustments to the reserves to reflect improvement
in write-offs and aging.
2006 SAG expenses of $4,008 million decreased from
2005 as a result of the following:
• $58 million reduction in selling expenses, including
lower marketing spending and headcount reductions.
• $59 million reduction in G&A expenses as a result of
continued expense management initiatives, including
benefits from restructuring.
• The above reductions were partially offset by a $15
million increase in bad debt expense.
Bad debt expense included in SAG was $134 million,
$87 million and $72 million in 2007, 2006 and 2005,
respectively. Both 2005 and, to a lesser extent, 2006
reflect the benefits associated with recoveries and
adjustments to the reserves as the result of improvements
in write-offs and aging. This favorable trend in write-offs,
receivables aging and collections continues to be reflected
in our current year bad debt expense. Bad debt expense as
a percent of total revenue was 0.8%, 0.5% and 0.5% for
2007, 2006 and 2005, respectively. At December 31,
2007, bad debt reserves, as a percentage of receivables,
were comparable to year end 2006.
Restructuring and Asset Impairment Charges
For the three years ended December 31, 2007, 2006
and 2005 we recorded restructuring and asset impairment
(credits)/charges of $(6) million, $385 million and $366
million, respectively. Restructuring activity was minimal in
2007 and the related credit of $6 million primarily reflects
changes in estimates for prior years’ severance costs.
2006 net charges of $318 million related to headcount
reductions of approximately 3,400 employees in North
America and Europe. Lease termination and asset
impairment net charges of $67 million primarily reflected
the relocation of certain manufacturing operations and
the exit from certain leased and owned facilities. 2005 net
charges of $350 million related to the elimination of
3,900 employees worldwide and the remaining $16
million of net charges related to asset impairments and
lease cancellations. The remaining restructuring reserve
balance as of December 31, 2007, for all programs was
$109 million. Refer to Note 9-Restructuring and Asset
Impairment Charges in the Consolidated Financial
Statements for further information regarding our
restructuring programs.
64