Xerox 2007 Annual Report Download - page 64
Download and view the complete annual report
Please find page 64 of the 2007 Xerox annual report below. You can navigate through the pages in the report by either clicking on the pages listed below, or by using the keyword search tool below to find specific information within the annual report.-
 1
1 -
2
-
3
-
4
-
5
-
6
-
7
-
8
-
9
-
10
-
11
-
12
-
13
-
14
-
15
-
16
-
17
-
18
-
19
-
20
-
21
-
22
-
23
-
24
-
25
-
26
-
27
-
28
-
29
-
30
-
31
-
32
-
33
-
34
-
35
-
36
-
37
-
38
-
39
-
40
-
41
-
42
-
43
-
44
-
45
-
46
-
47
-
48
-
49
-
50
-
51
-
52
-
53
-
 54
54 -
 55
55 -
 56
56 -
 57
57 -
 58
58 -
 59
59 -
 60
60 -
 61
61 -
 62
62 -
 63
63 -
 64
64 -
 65
65 -
 66
66 -
 67
67 -
 68
68 -
 69
69 -
 70
70 -
 71
71 -
 72
72 -
 73
73 -
 74
74 -
75
-
76
-
77
-
78
-
79
-
80
-
81
-
82
-
83
-
84
-
85
-
86
-
87
-
88
-
89
-
90
-
91
-
92
-
93
-
94
-
95
-
96
-
97
-
98
-
99
-
100
-
101
-
102
-
103
-
104
-
105
-
106
-
107
-
108
-
109
-
110
-
111
-
112
-
113
-
114
-
115
-
116
-
117
-
118
-
119
-
120
-
121
-
122
-
123
-
124
-
125
-
126
-
127
-
128
-
129
-
130
-
131
-
132
-
133
-
134
-
135
-
136
-
137
-
138
-
139
-
140
 |
 |
• 3% decrease in equipment sales revenue, including a
benefit from currency of 1-percentage point. Price
declines of less than 10% more than offset the growth
in office color multifunction and black-and-white
products. In addition, an increased proportion of office
equipment installed under operating lease contracts
were recognized in post sale revenue.
• 35% increase in installs of office color multifunction
systems.
• 8% increase in installs of black-and-white digital
copiers and multifunction devices. Install growth was
driven by 15% growth in Segments 3-5 devices (31-90
ppm) and 7% growth in Segments 1&2 devices (11-30
ppm).
• 5% decline in color printers as compared to 111%
growth in the comparable 2005 periods. The decline
reflects lower 2006 OEM sales.
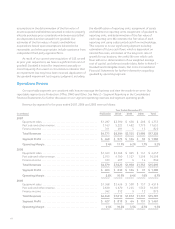
Operating Profit
2007 Operating profit of $973 million increased $141
million from 2006. The increase was primarily due to the
inclusion of GIS and higher gross profits partially offset by
higher SAG expenses.
2006 Operating profit of $832 million increased $13
million from 2005, reflecting the reduction in SAG
expenses partially offset by lower gross profit.
DMO
Revenue
2007 DMO revenue of $2,155 million increased 11%
from 2006, reflecting:
• Strong performance in Eurasia, Central and Eastern
Europe and the Middle East.
• 12% increase in post sale and other revenue, driven
primarily by increased supplies, document
management services and paper revenue.
• 9% increase in equipment sales revenue, reflecting
install growth in office multifunction devices, light
production black-and-white and production color
systems. DMO equipment sales consist of Office and
Production products, including a large proportion of
sales in Segment 1&2 office products.
2006 DMO revenue of $1,938 million increased 7%
from 2005, reflecting:
• 7% increase in post sale and other revenue, driven
primarily by growth in revenue from supplies, color
products and services.
• 8% increase in equipment sales revenue, reflecting
strong sales of Segments 1&2 devices, as well as install
growth in light production black-and-white and
production color systems.
Operating Profit
2007 Operating profit of $134 million increased $10
million from 2006 reflecting higher gross profit primarily
from increased revenue, partially offset by an increase in
SAG expenses.
2006 Operating profit of $124 million increased $60
million from 2005, reflecting higher gross profit and
reduction in SAG expenses.
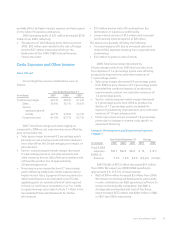
Other
Revenue
2007 Other revenue of $1,998 million increased 14%,
including a 3-percentage point benefit from currency,
primarily reflecting the inclusion of GIS as well as
increased paper and value-added services revenues. Paper
comprised approximately 40% of Other segment revenue.
2006 Other revenue of $1,753 million increased 1%
from 2005 reflecting:
• 11% decrease in equipment revenue driven by lower
equipment component sales included in value-added
services.
• 3% increase in post sale and other revenue from 2005,
including a benefit from currency of 1-percentage
point, due primarily to increased paper sales and
value-added services. Paper comprised approximately
two-thirds of the 2006 Other segment post sale and
other revenue.
Operating Profit
2007 Operating profit of $33 million increased $2
million from 2006 reflecting higher revenue as well as
lower currency exchange losses and litigation charges,
62