Vodafone 2003 Annual Report Download - page 96
Download and view the complete annual report
Please find page 96 of the 2003 Vodafone annual report below. You can navigate through the pages in the report by either clicking on the pages listed below, or by using the keyword search tool below to find specific information within the annual report.-
 1
1 -
2
-
3
-
4
-
5
-
6
-
7
-
8
-
9
-
10
-
11
-
12
-
13
-
14
-
15
-
16
-
17
-
18
-
19
-
20
-
21
-
22
-
23
-
24
-
25
-
26
-
27
-
28
-
29
-
30
-
31
-
32
-
33
-
34
-
35
-
36
-
37
-
38
-
39
-
40
-
41
-
42
-
43
-
44
-
45
-
46
-
47
-
48
-
49
-
50
-
51
-
52
-
53
-
54
-
55
-
56
-
57
-
58
-
59
-
60
-
61
-
62
-
63
-
64
-
65
-
66
-
67
-
68
-
69
-
70
-
71
-
72
-
73
-
74
-
75
-
76
-
77
-
78
-
79
-
80
-
81
-
82
-
83
-
84
-
85
-
 86
86 -
 87
87 -
 88
88 -
 89
89 -
 90
90 -
 91
91 -
 92
92 -
 93
93 -
 94
94 -
 95
95 -
 96
96 -
 97
97 -
 98
98 -
 99
99 -
 100
100 -
 101
101 -
 102
102 -
 103
103 -
 104
104 -
 105
105 -
 106
106 -
107
-
108
-
109
-
110
-
111
-
112
-
113
-
114
-
115
-
116
-
117
-
118
-
119
-
120
-
121
-
122
-
123
-
124
-
125
-
126
-
127
-
128
-
129
-
130
-
131
-
132
-
133
-
134
-
135
-
136
-
137
-
138
-
139
-
140
-
141
-
142
-
143
-
144
-
145
-
146
-
147
-
148
-
149
-
150
-
151
-
152
-
153
-
154
-
155
 |
 |

Vodafone Group Plc Annual Report & Accounts and Form 20-F 2003
94
NOTES TO THE CONSOLIDATED FINANCIAL STATEMENTS Continued
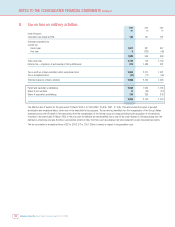
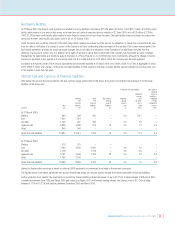
14. Impairment
In accordance with applicable accounting standards the Group regularly monitors the carrying value of its fixed assets. A review was undertaken at 31 March
2003 to assess whether the carrying value of assets was supported by the net present value of future cash flows derived from assets using cash flow
projections for each asset in respect of the period to 31 March 2013.
Cash flow projections for the mobile businesses reflect investment in network infrastructure to provide enhanced voice services and a platform for new data
products and services, enabled by GPRS and 3G technologies, which are forecast to be significant drivers of future revenue growth. Capital expenditure is
heaviest in the early years of the projections, but in most countries is expected to fall to below 10% of revenues by the year ended 31 March 2008. Revenue
growth is forecast from a combination of new customers and richer customer propositions. Data revenue is expected to increase significantly to 2009 but
grow at more modest rates to 2013. Voice ARPU is forecast to benefit in the longer term from new services and traffic moving from fixed networks to mobile
networks following a period of stabilisation reflecting the impact of price declines.
Accordingly, the directors believe that it is appropriate to use projections in excess of five years as growth in cash flows for the period to 31 March 2013 for
mobile businesses is expected to exceed relevant country growth in nominal GDP. For the years beyond 1 April 2013, forecast growth rates at nominal GDP
have been assumed for mobile businesses and below nominal GDP for non-mobile businesses. The discount rates for the major markets reviewed were
based on company specific pre-tax weighted average cost of capital percentages and ranged from 7.5% to 10.0% for mobile businesses.
In respect of the Group’s investment in China Mobile, the review assessed the carrying value against external analyst price targets.
The results of the review undertaken at 31 March 2003 indicated that, whilst no impairment charge is necessary in respect of the Group’s controlled mobile
businesses, impairment charges totalling £810m were necessary in respect of non-controlled mobile and non-mobile businesses.
2003
£m
Japan Telecom 430
Iusacell 80
China Mobile 300
810
The charge in respect of China Mobile and £25m of the charge for Japan Telecom are included within non-operating exceptional items.
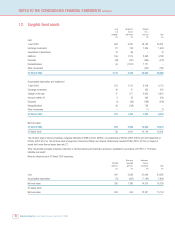
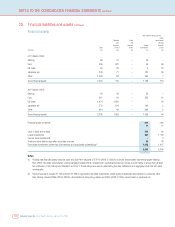
15. Stocks
Group
2003 2002
£m £m
Work in progress –208
Goods held for resale 365 305
365 513
Stocks are reported net of allowances for obsolescence, an analysis of which is as follows:
2003 2002 2001
£m £m £m
Opening balance at 1 April 126 32 9
Exchange adjustments 2(7) –
Amounts (credited)/charged to the profit and loss account (27) (5) 23
Acquisitions –106 –
Assets written off (12) ––
Closing balance at 31 March 89 126 32