Vodafone 2003 Annual Report Download - page 77
Download and view the complete annual report
Please find page 77 of the 2003 Vodafone annual report below. You can navigate through the pages in the report by either clicking on the pages listed below, or by using the keyword search tool below to find specific information within the annual report.-
 1
1 -
2
-
3
-
4
-
5
-
6
-
7
-
8
-
9
-
10
-
11
-
12
-
13
-
14
-
15
-
16
-
17
-
18
-
19
-
20
-
21
-
22
-
23
-
24
-
25
-
26
-
27
-
28
-
29
-
30
-
31
-
32
-
33
-
34
-
35
-
36
-
37
-
38
-
39
-
40
-
41
-
42
-
43
-
44
-
45
-
46
-
47
-
48
-
49
-
50
-
51
-
52
-
53
-
54
-
55
-
56
-
57
-
58
-
59
-
60
-
61
-
62
-
63
-
64
-
65
-
66
-
 67
67 -
 68
68 -
 69
69 -
 70
70 -
 71
71 -
 72
72 -
 73
73 -
 74
74 -
 75
75 -
 76
76 -
 77
77 -
 78
78 -
 79
79 -
 80
80 -
 81
81 -
 82
82 -
 83
83 -
 84
84 -
 85
85 -
 86
86 -
 87
87 -
88
-
89
-
90
-
91
-
92
-
93
-
94
-
95
-
96
-
97
-
98
-
99
-
100
-
101
-
102
-
103
-
104
-
105
-
106
-
107
-
108
-
109
-
110
-
111
-
112
-
113
-
114
-
115
-
116
-
117
-
118
-
119
-
120
-
121
-
122
-
123
-
124
-
125
-
126
-
127
-
128
-
129
-
130
-
131
-
132
-
133
-
134
-
135
-
136
-
137
-
138
-
139
-
140
-
141
-
142
-
143
-
144
-
145
-
146
-
147
-
148
-
149
-
150
-
151
-
152
-
153
-
154
-
155
 |
 |

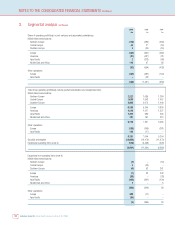
Vodafone Group Plc Annual Report & Accounts and Form 20-F 2003 75
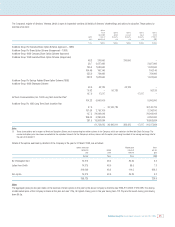
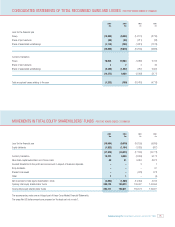
CONSOLIDATED STATEMENTS OF TOTAL RECOGNISED GAINS AND LOSSES FOR THE YEARS ENDED 31 MARCH
2003 2003 2002 2001
$m £m £m £m
Loss for the financial year
Group (14,288) (9,049) (14,131) (8,730)
Share of joint ventures (98) (62) (211) (32)
Share of associated undertakings (1,118) (708) (1,813) (1,123)
(15,504) (9,819) (16,155) (9,885)
Currency translation
Group 16,554 10,484 (1,980) 2,724
Share of joint ventures 32445
Share of associated undertakings (2,285) (1,447) (287) 2,403
(14,272) 9,039 (2,263) 5,172
Total recognised losses relating to the year (1,232) (780) (18,418) (4,713)
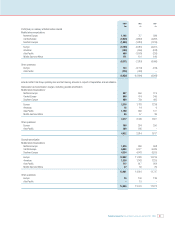
MOVEMENTS IN TOTAL EQUITY SHAREHOLDERS’ FUNDS FOR THE YEARS ENDED 31 MARCH
2003 2003 2002 2001
$m £m £m £m
Loss for the financial year (15,504) (9,819) (16,155) (9,885)
Equity dividends (1,822) (1,154) (1,025) (887)
(17,326) (10,973) (17,180) (10,772)
Currency translation 14,272 9,039 (2,263) 5,172
New share capital subscribed, net of issue costs 49 31 5,984 8,972
Goodwill transferred to the profit and loss account in respect of business disposals ––31
Scrip dividends ––– 67
Shares to be issued ––(978) 978
Other 21–(5)
Net movement in total equity shareholders’ funds (3,003) (1,902) (14,434) 4,413
Opening total equity shareholders’ funds 206,174 130,573 145,007 140,594
Closing total equity shareholders’ funds 203,171 128,671 130,573 145,007
The accompanying notes are an integral part of these Consolidated Financial Statements.
The unaudited US dollar amounts are prepared on the basis set out in note 1.