Vodafone 2003 Annual Report Download - page 114
Download and view the complete annual report
Please find page 114 of the 2003 Vodafone annual report below. You can navigate through the pages in the report by either clicking on the pages listed below, or by using the keyword search tool below to find specific information within the annual report.-
 1
1 -
2
-
3
-
4
-
5
-
6
-
7
-
8
-
9
-
10
-
11
-
12
-
13
-
14
-
15
-
16
-
17
-
18
-
19
-
20
-
21
-
22
-
23
-
24
-
25
-
26
-
27
-
28
-
29
-
30
-
31
-
32
-
33
-
34
-
35
-
36
-
37
-
38
-
39
-
40
-
41
-
42
-
43
-
44
-
45
-
46
-
47
-
48
-
49
-
50
-
51
-
52
-
53
-
54
-
55
-
56
-
57
-
58
-
59
-
60
-
61
-
62
-
63
-
64
-
65
-
66
-
67
-
68
-
69
-
70
-
71
-
72
-
73
-
74
-
75
-
76
-
77
-
78
-
79
-
80
-
81
-
82
-
83
-
84
-
85
-
86
-
87
-
88
-
89
-
90
-
91
-
92
-
93
-
94
-
95
-
96
-
97
-
98
-
99
-
100
-
101
-
102
-
103
-
 104
104 -
 105
105 -
 106
106 -
 107
107 -
 108
108 -
 109
109 -
 110
110 -
 111
111 -
 112
112 -
 113
113 -
 114
114 -
 115
115 -
 116
116 -
 117
117 -
 118
118 -
 119
119 -
 120
120 -
 121
121 -
 122
122 -
 123
123 -
 124
124 -
125
-
126
-
127
-
128
-
129
-
130
-
131
-
132
-
133
-
134
-
135
-
136
-
137
-
138
-
139
-
140
-
141
-
142
-
143
-
144
-
145
-
146
-
147
-
148
-
149
-
150
-
151
-
152
-
153
-
154
-
155
 |
 |

Vodafone Group Plc Annual Report & Accounts and Form 20-F 2003
112
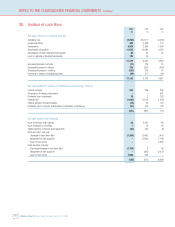
NOTES TO THE CONSOLIDATED FINANCIAL STATEMENTS Continued
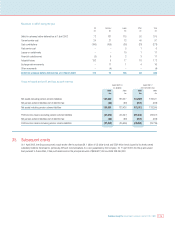
30. Analysis of cash flows
2003 2002 2001
£m £m £m
Net cash inflow from operating activities
Operating loss (5,295) (10,377) (6,439)
Exceptional items 496 4,486 176
Depreciation 3,979 2,880 1,593
Amortisation of goodwill 11,875 10,962 9,585
Amortisation of other intangible fixed assets 53 34 24
Loss on disposal of tangible fixed assets 109 46 –
11,217 8,031 4,939
(Increase)/decrease in stocks (17) 125 15
Decrease/(increase) in debtors 198 (242) (350)
(Decrease)/increase in creditors (233) 215 67
Payments in respect of exceptional items (23) (27) (84)
11,142 8,102 4,587
Net cash outflow for returns on investments and servicing of finance
Interest received 543 259 296
Termination of hedging instruments –– 901
Dividends from investments 15 2 102
Interest paid (1,004) (1,104) (1,254)
Interest element of finance leases (14) (9) (11)
Dividends paid to minority shareholders in subsidiary undertakings (91) (84) (81)
(551) (936) (47)
Net cash outflow from financing
Issue of ordinary share capital 28 3,581 65
Issue of shares to minorities 112 44
Capital element of finance lease payments (97) (46) (9)
Debt due within one year:
Decrease in short term debt (1,366) (2,486) (407)
Repayment of debt acquired –(1,256) (7,181)
Issue of new bonds –– 2,823
Debt due after one year:
(Decrease)/increase in long term debt (1,700) 646
Repayment of debt acquired –(991) (2,072)
Issue of new bonds 2,998 505 –
(136) (675) (6,691)