Vodafone 2003 Annual Report Download - page 89
Download and view the complete annual report
Please find page 89 of the 2003 Vodafone annual report below. You can navigate through the pages in the report by either clicking on the pages listed below, or by using the keyword search tool below to find specific information within the annual report.-
 1
1 -
2
-
3
-
4
-
5
-
6
-
7
-
8
-
9
-
10
-
11
-
12
-
13
-
14
-
15
-
16
-
17
-
18
-
19
-
20
-
21
-
22
-
23
-
24
-
25
-
26
-
27
-
28
-
29
-
30
-
31
-
32
-
33
-
34
-
35
-
36
-
37
-
38
-
39
-
40
-
41
-
42
-
43
-
44
-
45
-
46
-
47
-
48
-
49
-
50
-
51
-
52
-
53
-
54
-
55
-
56
-
57
-
58
-
59
-
60
-
61
-
62
-
63
-
64
-
65
-
66
-
67
-
68
-
69
-
70
-
71
-
72
-
73
-
74
-
75
-
76
-
77
-
78
-
 79
79 -
 80
80 -
 81
81 -
 82
82 -
 83
83 -
 84
84 -
 85
85 -
 86
86 -
 87
87 -
 88
88 -
 89
89 -
 90
90 -
 91
91 -
 92
92 -
 93
93 -
 94
94 -
 95
95 -
 96
96 -
 97
97 -
 98
98 -
 99
99 -
100
-
101
-
102
-
103
-
104
-
105
-
106
-
107
-
108
-
109
-
110
-
111
-
112
-
113
-
114
-
115
-
116
-
117
-
118
-
119
-
120
-
121
-
122
-
123
-
124
-
125
-
126
-
127
-
128
-
129
-
130
-
131
-
132
-
133
-
134
-
135
-
136
-
137
-
138
-
139
-
140
-
141
-
142
-
143
-
144
-
145
-
146
-
147
-
148
-
149
-
150
-
151
-
152
-
153
-
154
-
155
 |
 |

Vodafone Group Plc Annual Report & Accounts and Form 20-F 2003 87
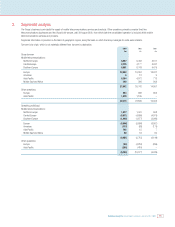
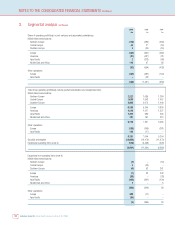
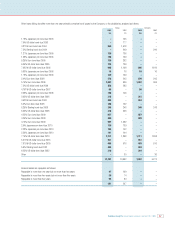
Reconciliation of expected tax charge using the standard tax rate to the actual current tax charge
The differences between the Group’s expected tax charge, using the Group’s standard corporation tax rate of 37.0% in 2003 (37.2% in 2002 and 2001),
comprising the average rates of tax payable across the Group and weighted in proportion to accounting profits, and the Group’s current tax charge for each
of those years were as follows:
2003 2002 2001
£m £m £m
Expected tax credit at standard tax rate on loss on ordinary activities (2,295) (5,037) (3,008)
Amortisation of goodwill 5,196 5,011 4,417
Exceptional non-operating items 2320 (30)
Exceptional operating items 213 2,012 119
Expected tax charge at standard tax rate on profit on ordinary activities,
before goodwill amortisation and exceptional items 3,116 2,306 1,498
Permanent differences 140 111 386
Excess tax depreciation over book depreciation (404) (423) (131)
Short term timing differences (64) (559) (215)
Deferred tax on overseas earnings (424) (491) (79)
Losses carried forward utilised/current year losses for which no credit taken 278 415 264
Prior year adjustments 4(92) (43)
Non taxable profits/non deductible losses (239) (392) (482)
International corporate tax rate differentials and other (232) (153) (98)
Actual current tax charge (excluding tax on exceptional items) 2,175 722 1,100
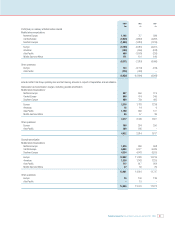
Reconciliation of expected tax charge using the UK statutory tax rate to the actual tax charge
The differences between the Group’s expected tax charge, using the UK corporation tax rate of 30% in 2003, 2002 and 2001 and the Group’s tax charge for
each of those years were as follows: 2003 2002 2001
£m £m £m
Expected tax credit at UK corporation tax rate on loss on ordinary activities (1,863) (4,062) (2,426)
Amortisation of goodwill 4,217 4,041 3,562
Exceptional non-operating items 2258 (24)
Exceptional operating items 173 1,622 96
Expected tax charge at UK corporation tax rate, before goodwill amortisation and exceptional items 2,529 1,859 1,208
Permanent differences 165 126 403
Excess tax depreciation over book depreciation (40) 626
Short term timing differences 60 12 (2)
Losses carried forward utilised/current year losses for which no credit taken 161 385 261
Prior year adjustments (9) (79) (44)
Net under/(over) charge relating to international associated undertakings 8–(56)
Non taxable profits/non deductible losses (239) (392) (482)
International corporate tax rate differentials and other 358 294 167
Actual total tax charge (excluding tax on exceptional items) 2,993 2,211 1,481
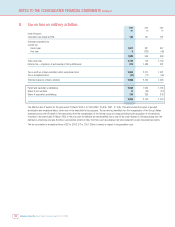
At 31 March 2003, the Group had the following trading and non-trading losses available for carry forward. These losses are available for offset against future
trading and non-trading profits of certain Group, joint venture and associated undertakings: £m
UK subsidiaries’ trading and non-trading losses 173
International subsidiaries’ trading and non-trading losses 38,921
Share of international associated undertakings’ trading and non-trading losses 225
The loss in respect of international subsidiaries includes an amount of £34,142m that arose in an overseas holding company from the revaluation for local
GAAP purposes of that company’s investments. The revaluation gives rise to a tax-deductible loss in the local company however, since it is uncertain whether
this loss can be utilised, no deferred tax asset has been recognised. See note 22. Furthermore, any subsequent upward revaluation of the asset would cause
a recapture of the losses in future years.