Vodafone 2003 Annual Report Download - page 119
Download and view the complete annual report
Please find page 119 of the 2003 Vodafone annual report below. You can navigate through the pages in the report by either clicking on the pages listed below, or by using the keyword search tool below to find specific information within the annual report.-
 1
1 -
2
-
3
-
4
-
5
-
6
-
7
-
8
-
9
-
10
-
11
-
12
-
13
-
14
-
15
-
16
-
17
-
18
-
19
-
20
-
21
-
22
-
23
-
24
-
25
-
26
-
27
-
28
-
29
-
30
-
31
-
32
-
33
-
34
-
35
-
36
-
37
-
38
-
39
-
40
-
41
-
42
-
43
-
44
-
45
-
46
-
47
-
48
-
49
-
50
-
51
-
52
-
53
-
54
-
55
-
56
-
57
-
58
-
59
-
60
-
61
-
62
-
63
-
64
-
65
-
66
-
67
-
68
-
69
-
70
-
71
-
72
-
73
-
74
-
75
-
76
-
77
-
78
-
79
-
80
-
81
-
82
-
83
-
84
-
85
-
86
-
87
-
88
-
89
-
90
-
91
-
92
-
93
-
94
-
95
-
96
-
97
-
98
-
99
-
100
-
101
-
102
-
103
-
104
-
105
-
106
-
107
-
108
-
 109
109 -
 110
110 -
 111
111 -
 112
112 -
 113
113 -
 114
114 -
 115
115 -
 116
116 -
 117
117 -
 118
118 -
 119
119 -
 120
120 -
 121
121 -
 122
122 -
 123
123 -
 124
124 -
 125
125 -
 126
126 -
 127
127 -
 128
128 -
 129
129 -
130
-
131
-
132
-
133
-
134
-
135
-
136
-
137
-
138
-
139
-
140
-
141
-
142
-
143
-
144
-
145
-
146
-
147
-
148
-
149
-
150
-
151
-
152
-
153
-
154
-
155
 |
 |

Vodafone Group Plc Annual Report & Accounts and Form 20-F 2003 117
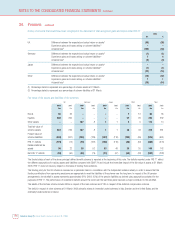
Additional disclosures in respect of FRS 17
The most recent full formal actuarial valuations for defined benefit schemes have been updated by qualified independent actuaries for the financial year
ended 31 March 2003 to derive the FRS 17 disclosures below.
Major assumptions used
UK Germany Japan(1) Other(2)
2003 2002 2003 2002 2003 2002 2003 2002
%%%%%%%%
Rate of inflation 2.5 2.5 1.5 2.0 ––1.8 2.0
Rate of increase in salaries 4.5 4.5 3.5 4.0 ––3.5 4.2
Rate of increase in pensions in payment 2.5 2.5 1.5 2.0 N/a N/a 1.9 2.2
Rate of increase in deferred pensions 2.5 2.5 ––N/a N/a 1.9 2.2
Discount rate 5.4 6.0 5.3 6.3 1.5 2.5 5.3 6.2
Notes:
(1) Rate of increase in salaries in Japan is calculated in line with company specific experience.
(2) Figures shown for other schemes represent weighted average assumptions of individual schemes.
The expected rates of return were:
UK Germany Japan Other
2003 2002 2003 2002 2003 2002 2003 2002
%%%%%%%%
Bonds 5.5 6.0 4.8 N/a N/a N/a 4.9 5.5
Equities 8.0 8.0 7.3 N/a N/a N/a 7.8 8.5
Other assets 4.5 6.0 2.8 6.0 3.0 4.4 3.5 5.3
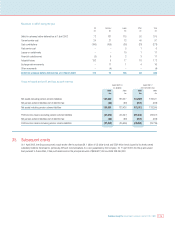
Charges that would have been made to the profit and loss account and consolidated statement of total recognised gains and losses on full
compliance with FRS17 and on the basis of the assumptions stated above
UK Germany Japan Other Total
£m £m £m £m £m
Operating profit:
Current service cost 24 21 12 40 97
Past service cost ––516
Gains and losses on curtailments ––10 1 11
Total charge to operating profit 24 21 27 42 114
Finance (income)/costs:
Interest cost 19 10 2 6 37
Expected return on pension scheme assets (22) (1) –(3) (26)
Total (credit)/charge to finance (income)/costs (3) 9 2 3 11
Total charge to loss before taxation 21 30 29 45 125
Consolidated statement of total recognised gains and losses:
Actual return less expected return on pension scheme assets 95 1 – 14 110
Experience gains and losses arising on the scheme liabilities – (7) 1 (1) (7)
Changes in assumptions underlying the present value of the plan liabilities 37 11 16 5 69
Actuarial losses on assets and liabilities 132 5 17 18 172
Exchange rate movements – 111416
Total loss recognised in statement of total recognised gains and losses 132 16 18 22 188