Vodafone 2003 Annual Report Download - page 84
Download and view the complete annual report
Please find page 84 of the 2003 Vodafone annual report below. You can navigate through the pages in the report by either clicking on the pages listed below, or by using the keyword search tool below to find specific information within the annual report.-
 1
1 -
2
-
3
-
4
-
5
-
6
-
7
-
8
-
9
-
10
-
11
-
12
-
13
-
14
-
15
-
16
-
17
-
18
-
19
-
20
-
21
-
22
-
23
-
24
-
25
-
26
-
27
-
28
-
29
-
30
-
31
-
32
-
33
-
34
-
35
-
36
-
37
-
38
-
39
-
40
-
41
-
42
-
43
-
44
-
45
-
46
-
47
-
48
-
49
-
50
-
51
-
52
-
53
-
54
-
55
-
56
-
57
-
58
-
59
-
60
-
61
-
62
-
63
-
64
-
65
-
66
-
67
-
68
-
69
-
70
-
71
-
72
-
73
-
 74
74 -
 75
75 -
 76
76 -
 77
77 -
 78
78 -
 79
79 -
 80
80 -
 81
81 -
 82
82 -
 83
83 -
 84
84 -
 85
85 -
 86
86 -
 87
87 -
 88
88 -
 89
89 -
 90
90 -
 91
91 -
 92
92 -
 93
93 -
 94
94 -
95
-
96
-
97
-
98
-
99
-
100
-
101
-
102
-
103
-
104
-
105
-
106
-
107
-
108
-
109
-
110
-
111
-
112
-
113
-
114
-
115
-
116
-
117
-
118
-
119
-
120
-
121
-
122
-
123
-
124
-
125
-
126
-
127
-
128
-
129
-
130
-
131
-
132
-
133
-
134
-
135
-
136
-
137
-
138
-
139
-
140
-
141
-
142
-
143
-
144
-
145
-
146
-
147
-
148
-
149
-
150
-
151
-
152
-
153
-
154
-
155
 |
 |
Vodafone Group Plc Annual Report & Accounts and Form 20-F 2003
82
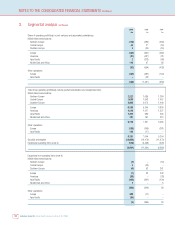
NOTES TO THE CONSOLIDATED FINANCIAL STATEMENTS Continued
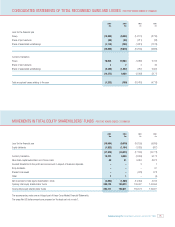
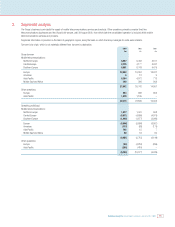
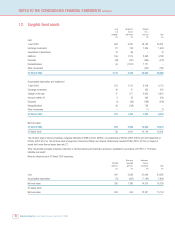
3. Segmental analysis continued
2003 2002
£m £m
Net assets/(liabilities) and attributed goodwill (before net borrowings) of subsidiary undertakings
Mobile telecommunications:
Northern Europe 10,765 10,415
Central Europe 50,090 50,581
Southern Europe 42,661 39,773
Europe 103,516 100,769
Americas (1,771) (1,444)
Asia Pacific 14,880 15,784
Middle East and Africa 568 809
117,193 115,918
Other operations:
Europe 419 287
Asia Pacific 1,936 1,956
119,548 118,161
Share of net assets and attributed goodwill of joint ventures and associated undertakings
Mobile telecommunications:
Northern Europe 4,958 3,374
Central Europe 2,216 2,203
Southern Europe 100 114
Europe 7,274 5,691
Americas 18,236 21,356
Asia Pacific 32 41
Middle East and Africa 337 179
25,879 27,267
Other operations:
Europe (64) 19
Asia Pacific 10 15
25,825 27,301
Total net assets, before net borrowings 145,373 145,462
Net borrowings (13,839) (12,034)
131,534 133,428
The Group’s total net assets, before net borrowings, primarily comprise long-lived assets of £154,689m (2002: £153,462m).
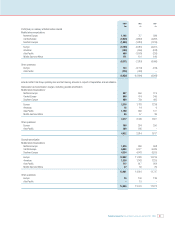
2003 2002 2001
£m £m £m
Capital expenditure on intangible and tangible fixed assets (excluding goodwill)
Mobile telecommunications:
Northern Europe 1,001 925 7,529
Central Europe 893 1,028 6,200
Southern Europe 1,270 1,695 2,552
Europe 3,164 3,648 16,281
Americas 923 67
Asia Pacific 1,393 826 366
Middle East and Africa 56 152 174
4,622 4,649 16,888
Other operations:
Europe 135 214 380
Asia Pacific 186 255 –
4,943 5,118 17,268