Vodafone 2003 Annual Report Download - page 86
Download and view the complete annual report
Please find page 86 of the 2003 Vodafone annual report below. You can navigate through the pages in the report by either clicking on the pages listed below, or by using the keyword search tool below to find specific information within the annual report.-
 1
1 -
2
-
3
-
4
-
5
-
6
-
7
-
8
-
9
-
10
-
11
-
12
-
13
-
14
-
15
-
16
-
17
-
18
-
19
-
20
-
21
-
22
-
23
-
24
-
25
-
26
-
27
-
28
-
29
-
30
-
31
-
32
-
33
-
34
-
35
-
36
-
37
-
38
-
39
-
40
-
41
-
42
-
43
-
44
-
45
-
46
-
47
-
48
-
49
-
50
-
51
-
52
-
53
-
54
-
55
-
56
-
57
-
58
-
59
-
60
-
61
-
62
-
63
-
64
-
65
-
66
-
67
-
68
-
69
-
70
-
71
-
72
-
73
-
74
-
75
-
 76
76 -
 77
77 -
 78
78 -
 79
79 -
 80
80 -
 81
81 -
 82
82 -
 83
83 -
 84
84 -
 85
85 -
 86
86 -
 87
87 -
 88
88 -
 89
89 -
 90
90 -
 91
91 -
 92
92 -
 93
93 -
 94
94 -
 95
95 -
 96
96 -
97
-
98
-
99
-
100
-
101
-
102
-
103
-
104
-
105
-
106
-
107
-
108
-
109
-
110
-
111
-
112
-
113
-
114
-
115
-
116
-
117
-
118
-
119
-
120
-
121
-
122
-
123
-
124
-
125
-
126
-
127
-
128
-
129
-
130
-
131
-
132
-
133
-
134
-
135
-
136
-
137
-
138
-
139
-
140
-
141
-
142
-
143
-
144
-
145
-
146
-
147
-
148
-
149
-
150
-
151
-
152
-
153
-
154
-
155
 |
 |
Vodafone Group Plc Annual Report & Accounts and Form 20-F 2003
84
NOTES TO THE CONSOLIDATED FINANCIAL STATEMENTS Continued
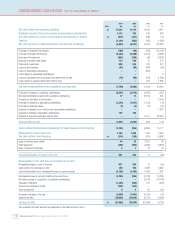
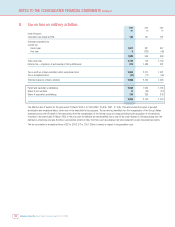
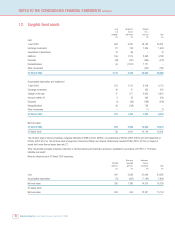
5. Operating loss continued
Operating loss has been arrived at after charging: 2003 2002 2001
£m £m £m
Depreciation of tangible fixed assets:
Owned assets 3,783 2,702 1,568
Leased assets 196 178 25
Amortisation of goodwill 11,875 10,962 9,585
Amortisation of other intangible fixed assets 53 34 24
Research and development 164 110 72
Bad debt expense 193 196 127
Payments under operating leases:
Plant and machinery 78 38 19
Other assets 392 307 229
Auditors’ remuneration (see below):
Audit work 543
Other fees:
United Kingdom 2– 2
Overseas 656
During the year ended 31 March 2003, £207m (2002: £163m) of own costs directly attributable to the construction or acquisition of tangible fixed assets
were capitalised.
Auditors’ other fees incurred on acquisitions and specific capital projects and business acquisitions and disposals during the year totalling £7m
(2002: £17m) have been excluded from the above analysis, of which £6m (2002: £2m) was incurred by overseas operations. The total amount charged by
Deloitte & Touche for non-audit assignments of £15m (2002: £22m) is analysed below:
2003 2002
£m £m
Audit related fees:
Due diligence reviews –3
Tax fees:
Compliance 11
Other tax advice 2–
Other fees:
IT consultancy 10 18
Other 2–
15 22
Fees for IT consultancy for 2002 include £14m in respect of a contract awarded in 2000 and completed in 2002.
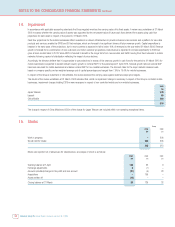
Joint ventures and associated undertakings
Group turnover includes sales to joint ventures and associated undertakings of £40m (2002: £27m, 2001: £211m), primarily comprising network airtime and
access charges. Total operating costs include charges from joint ventures and associated undertakings of £91m (2002: £42m, 2001: £84m), primarily
comprising roaming charges.
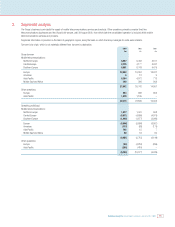
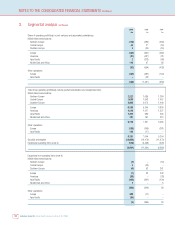
The Group’s share of the turnover and operating loss of joint ventures and associated undertakings is further analysed as follows:
2003 2002 2001
£m £m £m
Share of turnover:
Joint ventures 8398
Associated undertakings 8,769 10,693 8,891
8,777 10,696 8,989
Share of operating loss:
Joint ventures (39) (231) (42)
Associated undertakings (117) (1,226) (508)
(156) (1,457) (550)