Vodafone 2003 Annual Report Download - page 74
Download and view the complete annual report
Please find page 74 of the 2003 Vodafone annual report below. You can navigate through the pages in the report by either clicking on the pages listed below, or by using the keyword search tool below to find specific information within the annual report.-
 1
1 -
2
-
3
-
4
-
5
-
6
-
7
-
8
-
9
-
10
-
11
-
12
-
13
-
14
-
15
-
16
-
17
-
18
-
19
-
20
-
21
-
22
-
23
-
24
-
25
-
26
-
27
-
28
-
29
-
30
-
31
-
32
-
33
-
34
-
35
-
36
-
37
-
38
-
39
-
40
-
41
-
42
-
43
-
44
-
45
-
46
-
47
-
48
-
49
-
50
-
51
-
52
-
53
-
54
-
55
-
56
-
57
-
58
-
59
-
60
-
61
-
62
-
63
-
 64
64 -
 65
65 -
 66
66 -
 67
67 -
 68
68 -
 69
69 -
 70
70 -
 71
71 -
 72
72 -
 73
73 -
 74
74 -
 75
75 -
 76
76 -
 77
77 -
 78
78 -
 79
79 -
 80
80 -
 81
81 -
 82
82 -
 83
83 -
 84
84 -
85
-
86
-
87
-
88
-
89
-
90
-
91
-
92
-
93
-
94
-
95
-
96
-
97
-
98
-
99
-
100
-
101
-
102
-
103
-
104
-
105
-
106
-
107
-
108
-
109
-
110
-
111
-
112
-
113
-
114
-
115
-
116
-
117
-
118
-
119
-
120
-
121
-
122
-
123
-
124
-
125
-
126
-
127
-
128
-
129
-
130
-
131
-
132
-
133
-
134
-
135
-
136
-
137
-
138
-
139
-
140
-
141
-
142
-
143
-
144
-
145
-
146
-
147
-
148
-
149
-
150
-
151
-
152
-
153
-
154
-
155
 |
 |

Vodafone Group Plc Annual Report & Accounts and Form 20-F 2003
72
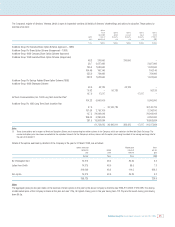
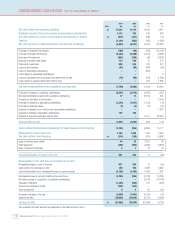
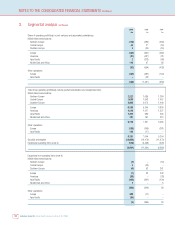
CONSOLIDATED PROFIT AND LOSS ACCOUNTS FOR THE YEARS ENDED 31 MARCH
2003 2003 2002 2001
Note $m £m £m £m
Total Group turnover
Group and share of joint ventures and associated undertakings 61,821 39,152 33,541 23,993
Less: Share of joint ventures (13) (8) (3) (98)
Share of associated undertakings (13,846) (8,769) (10,693) (8,891)
347,962 30,375 22,845 15,004
Group turnover 347,962 30,375 22,845 15,004
Operating loss 3, 5 (8,361) (5,295) (10,377) (6,439)
Share of operating loss in joint ventures and associated undertakings (246) (156) (1,457) (550)
Total Group operating loss
Group and share of joint ventures and associated undertakings 3(8,607) (5,451) (11,834) (6,989)
Exceptional non-operating items 6(9) (5) (860) 80
Loss on ordinary activities before interest 3(8,616) (5,456) (12,694) (6,909)
Net interest payable and similar items 7(1,187) (752) (845) (1,177)
Group (721) (457) (503) (850)
Share of joint ventures and associated undertakings (466) (295) (342) (327)
Loss on ordinary activities before taxation (9,803) (6,208) (13,539) (8,086)
Tax on loss on ordinary activities 8(4,667) (2,956) (2,140) (1,426)
Group (4,143) (2,624) (1,925) (1,195)
Share of joint ventures and associated undertakings (524) (332) (215) (231)
Loss on ordinary activities after taxation (14,470) (9,164) (15,679) (9,512)
Equity minority interests (936) (593) (415) (314)
Non-equity minority interests (98) (62) (61) (59)
Loss for the financial year (15,504) (9,819) (16,155) (9,885)
Equity dividends 9(1,822) (1,154) (1,025) (887)
Retained loss for the Group and its share of joint ventures and associated undertakings 24 (17,326) (10,973) (17,180) (10,772)
Basic and diluted loss per share 10 (22.75)¢ (14.41)p (23.77)p (16.09)p
The accompanying notes are an integral part of these Consolidated Financial Statements.
The unaudited US dollar amounts are prepared on the basis set out in note 1.