Vodafone 2003 Annual Report Download - page 120
Download and view the complete annual report
Please find page 120 of the 2003 Vodafone annual report below. You can navigate through the pages in the report by either clicking on the pages listed below, or by using the keyword search tool below to find specific information within the annual report.-
 1
1 -
2
-
3
-
4
-
5
-
6
-
7
-
8
-
9
-
10
-
11
-
12
-
13
-
14
-
15
-
16
-
17
-
18
-
19
-
20
-
21
-
22
-
23
-
24
-
25
-
26
-
27
-
28
-
29
-
30
-
31
-
32
-
33
-
34
-
35
-
36
-
37
-
38
-
39
-
40
-
41
-
42
-
43
-
44
-
45
-
46
-
47
-
48
-
49
-
50
-
51
-
52
-
53
-
54
-
55
-
56
-
57
-
58
-
59
-
60
-
61
-
62
-
63
-
64
-
65
-
66
-
67
-
68
-
69
-
70
-
71
-
72
-
73
-
74
-
75
-
76
-
77
-
78
-
79
-
80
-
81
-
82
-
83
-
84
-
85
-
86
-
87
-
88
-
89
-
90
-
91
-
92
-
93
-
94
-
95
-
96
-
97
-
98
-
99
-
100
-
101
-
102
-
103
-
104
-
105
-
106
-
107
-
108
-
109
-
 110
110 -
 111
111 -
 112
112 -
 113
113 -
 114
114 -
 115
115 -
 116
116 -
 117
117 -
 118
118 -
 119
119 -
 120
120 -
 121
121 -
 122
122 -
 123
123 -
 124
124 -
 125
125 -
 126
126 -
 127
127 -
 128
128 -
 129
129 -
 130
130 -
131
-
132
-
133
-
134
-
135
-
136
-
137
-
138
-
139
-
140
-
141
-
142
-
143
-
144
-
145
-
146
-
147
-
148
-
149
-
150
-
151
-
152
-
153
-
154
-
155
 |
 |

Vodafone Group Plc Annual Report & Accounts and Form 20-F 2003
118
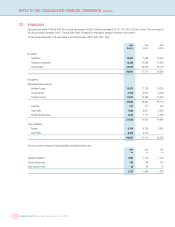
NOTES TO THE CONSOLIDATED FINANCIAL STATEMENTS Continued
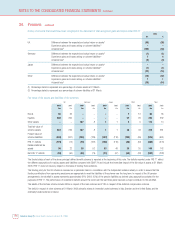
History of amounts that would have been recognised in the statement of total recognised gains and losses under FRS 17
2003
£m %
UK Difference between the expected and actual return on assets(1) (95) (36)
Experience gains and losses arising on scheme liabilities(2) ––
Actuarial loss(2) (132) (34)
Germany Difference between the expected and actual return on assets(1) (1) (1)
Experience gains and losses arising on scheme liabilities(2) 74
Actuarial loss(2) (5) (3)
Japan Difference between the expected and actual return on assets(1) ––
Experience gains and losses arising on scheme liabilities(2) (1) (1)
Actuarial loss(2) (17) (13)
Other Difference between the expected and actual return on assets(1) (14) (37)
Experience gains and losses arising on scheme liabilities(2) 11
Actuarial loss(2) (18) (14)
(1) Percentage stated is expressed as a percentage of scheme assets at 31 March.
(2) Percentage stated is expressed as a percentage of scheme liabilities at 31 March.
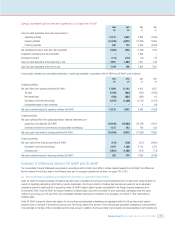
Fair value of the assets and liabilities of the schemes
UK Germany Japan Other Total
2003 2002 2003 2002 2003 2002 2003 2002 2003 2002
£m £m £m £m £m £m £m £m £m £m
Bonds 56 23 ––––712 63 35
Equities 208 206 ––––27 26 235 232
Other assets ––107 81145112 14
Total fair value of
scheme assets 264 229 107 81138 43 410 281
Present value of
scheme liabilities (383) (301) (180) (139) (127) (116) (126) (95) (816) (651)
FRS 17 deficits (119) (72) (73) (131) (126) (115) (88) (52) (406) (370)
Related deferred tax
assets 36 22 30 52 53 48 30 20 149 142
Net FRS 17 deficits (83) (50) (43) (79) (73) (67) (58) (32) (257) (228)
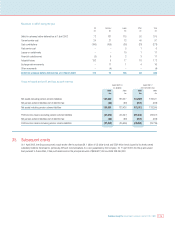
The funded status of each of the above principal defined benefit schemes is reported at the beginning of this note. The deficits reported under FRS 17 reflect
the different assumptions for valuing assets and liabilities compared with SSAP 24 and include the immediate impact of the fair value of assets at 31 March
2003. FRS 17 does not have any impact on the basis of funding these schemes.
The funding policy for the UK scheme is reviewed on a systematic basis in consultation with the independent scheme actuary in order to ensure that the
funding contributions from sponsoring employers are appropriate to meet the liabilities of the scheme over the long term. In respect of the UK pension
arrangements, the shortfall in assets represents approximately 31% (2002: 25%) of the pension liabilities as derived using assumptions adopted for the
purposes of FRS 17. The performance of investment markets around the world over the last three years has been a major contributor to this shortfall.
The assets of the German scheme include £95m in respect of the main scheme and £12m in respect of the deferred compensation scheme.
The deficit in respect of other schemes at 31 March 2003 primarily relates to internally funded schemes in Italy, Sweden and the United States and the
externally funded scheme in Ireland.
34. Pensions continued