Vodafone 2003 Annual Report Download - page 24
Download and view the complete annual report
Please find page 24 of the 2003 Vodafone annual report below. You can navigate through the pages in the report by either clicking on the pages listed below, or by using the keyword search tool below to find specific information within the annual report.-
 1
1 -
2
-
3
-
4
-
5
-
6
-
7
-
8
-
9
-
10
-
11
-
12
-
13
-
 14
14 -
 15
15 -
 16
16 -
 17
17 -
 18
18 -
 19
19 -
 20
20 -
 21
21 -
 22
22 -
 23
23 -
 24
24 -
 25
25 -
 26
26 -
 27
27 -
 28
28 -
 29
29 -
 30
30 -
 31
31 -
 32
32 -
 33
33 -
 34
34 -
35
-
36
-
37
-
38
-
39
-
40
-
41
-
42
-
43
-
44
-
45
-
46
-
47
-
48
-
49
-
50
-
51
-
52
-
53
-
54
-
55
-
56
-
57
-
58
-
59
-
60
-
61
-
62
-
63
-
64
-
65
-
66
-
67
-
68
-
69
-
70
-
71
-
72
-
73
-
74
-
75
-
76
-
77
-
78
-
79
-
80
-
81
-
82
-
83
-
84
-
85
-
86
-
87
-
88
-
89
-
90
-
91
-
92
-
93
-
94
-
95
-
96
-
97
-
98
-
99
-
100
-
101
-
102
-
103
-
104
-
105
-
106
-
107
-
108
-
109
-
110
-
111
-
112
-
113
-
114
-
115
-
116
-
117
-
118
-
119
-
120
-
121
-
122
-
123
-
124
-
125
-
126
-
127
-
128
-
129
-
130
-
131
-
132
-
133
-
134
-
135
-
136
-
137
-
138
-
139
-
140
-
141
-
142
-
143
-
144
-
145
-
146
-
147
-
148
-
149
-
150
-
151
-
152
-
153
-
154
-
155
 |
 |

Vodafone Group Plc Annual Report & Accounts and Form 20-F 2003
22
INFORMATION ON THE COMPANY Continued
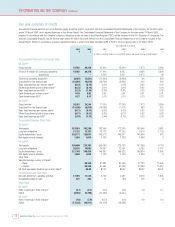
Five year summary of results
The selected financial data set out on the following pages should be read in conjunction with the Consolidated Financial Statements of the Company for the three years
ended 31 March 2003, which appear elsewhere in this Annual Report. The Consolidated Financial Statements of the Company for the year ended 31 March 2003,
prepared in accordance with the Company’s statutory obligations under the laws of the United Kingdom (“UK”), will be delivered to the UK’s Registrar of Companies. The
selected consolidated financial data for the five years ended 31 March 2003 are derived from the Consolidated Financial Statements of the Company included in this
Annual Report. Solely for convenience, amounts represented below in dollars have been translated at $1.5790:£1, the noon buying rate on 31 March 2003.
Year ended and at 31 March
2003 2003 2002(1) 2001
(1)(7) 2000(2)(7) 1999(7)
$£ ££££
(in millions, except per ordinary share and ADS amounts and ratio of earnings to fixed charges)
Consolidated Profit and Loss Account Data
UK GAAP(3)
Group turnover 47,962 30,375 22,845 15,004 7,873 3,360
Of which in respect of: continuing operations 47,962 30,375 17,940 6,637 4,498 3,302
acquisitions ––4,905 8,367 3,375 58
Total Group operating (loss)/profit (8,607) (5,451) (11,834) (6,989) 798 963
(Loss)/profit for the financial year (15,504) (9,819) (16,155) (9,885) 542 594
Basic (loss)/earnings per ordinary share(4) (0.23) (0.14) (0.24) (0.16) 0.02 0.04
Diluted (loss)/earnings per ordinary share(4) (0.23) (0.14) (0.24) (0.16) 0.02 0.04
Basic (loss)/earnings per ADS(4) (2.27) (1.44) (2.38) (1.61) 0.20 0.38
Cash dividends per ordinary share(5) 0.03 0.02 0.01 0.01 0.01 0.01
Cash dividends per ADS(5) 0.27 0.17 0.15 0.14 0.13 0.13
US GAAP(3)
Group turnover 38,281 24,244 17,639 11,103 7,873 3,360
(Loss)/profit for the financial year (14,298) (9,055) (16,688) (7,071) 553 510
Basic (loss)/earnings per ordinary share(4) (0.21) (0.13) (0.25) (0.12) 0.02 0.03
Diluted (loss)/earnings per ordinary share (0.21) (0.13) (0.25) (0.12) 0.02 0.03
Basic (loss)/earnings per ADS(4) (2.10) (1.33) (2.46) (1.15) 0.20 0.33
Consolidated Balance Sheet Data
UK GAAP(3)
Total assets 257,819 163,280 162,900 172,390 153,546 3,681
Long term obligations 21,722 13,757 13,118 11,235 6,374 1,179
Equity shareholders’ funds 203,171 128,671 130,573 145,007 140,594 512
Non-equity minority interests 1,603 1,015 1,128 1,129 1,004 4
US GAAP(3)
Total assets 359,666 227,781 206,666 215,123 167,259 4,719
Long term obligations 26,532 16,803 14,897 12,291 6,382 1,187
Equity shareholders’ funds 221,748 140,436 140,887 155,522 146,334 1,858
Non-equity minority interests 1,603 1,015 1,128 1,129 1,004 4
Other Data
Weighted average number of shares(4)
– Basic 68,155 67,961 61,439 27,100 15,445
– Diluted 68,155 67,961 61,439 27,360 15,510
US dollar equivalent dividends per ordinary share(5) $0.03 $0.02 $0.02 $0.02 $0.02
Consolidated Cash Flow Data
Net cash inflow from operating activities 17,593 11,142 8,102 4,587 2,510 1,045
Increase/(decrease) in cash 621 393 11 (55) 116 (7)
Other Data
UK GAAP
Ratio of earnings to fixed charges(6) (2.7) (2.7) (8.9) (4.2) 4.0 6.7
Deficit (8,053) (5,100) (11,695) (6,947) ––
US GAAP
Ratio of earnings to fixed charges(6) (7.0) (7.0) (15.2) (6.6) 3.9 6.4
Deficit (17,228) (10,911) (19,119) (10,038) ––