Vodafone 2003 Annual Report Download - page 134
Download and view the complete annual report
Please find page 134 of the 2003 Vodafone annual report below. You can navigate through the pages in the report by either clicking on the pages listed below, or by using the keyword search tool below to find specific information within the annual report.-
 1
1 -
2
-
3
-
4
-
5
-
6
-
7
-
8
-
9
-
10
-
11
-
12
-
13
-
14
-
15
-
16
-
17
-
18
-
19
-
20
-
21
-
22
-
23
-
24
-
25
-
26
-
27
-
28
-
29
-
30
-
31
-
32
-
33
-
34
-
35
-
36
-
37
-
38
-
39
-
40
-
41
-
42
-
43
-
44
-
45
-
46
-
47
-
48
-
49
-
50
-
51
-
52
-
53
-
54
-
55
-
56
-
57
-
58
-
59
-
60
-
61
-
62
-
63
-
64
-
65
-
66
-
67
-
68
-
69
-
70
-
71
-
72
-
73
-
74
-
75
-
76
-
77
-
78
-
79
-
80
-
81
-
82
-
83
-
84
-
85
-
86
-
87
-
88
-
89
-
90
-
91
-
92
-
93
-
94
-
95
-
96
-
97
-
98
-
99
-
100
-
101
-
102
-
103
-
104
-
105
-
106
-
107
-
108
-
109
-
110
-
111
-
112
-
113
-
114
-
115
-
116
-
117
-
118
-
119
-
120
-
121
-
122
-
123
-
 124
124 -
 125
125 -
 126
126 -
 127
127 -
 128
128 -
 129
129 -
 130
130 -
 131
131 -
 132
132 -
 133
133 -
 134
134 -
 135
135 -
 136
136 -
 137
137 -
 138
138 -
 139
139 -
 140
140 -
 141
141 -
 142
142 -
 143
143 -
 144
144 -
145
-
146
-
147
-
148
-
149
-
150
-
151
-
152
-
153
-
154
-
155
 |
 |

Vodafone Group Plc Annual Report & Accounts and Form 20-F 2003
132
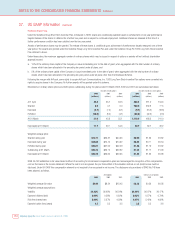
NOTES TO THE CONSOLIDATED FINANCIAL STATEMENTS Continued
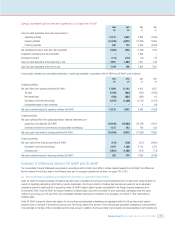
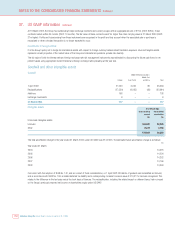
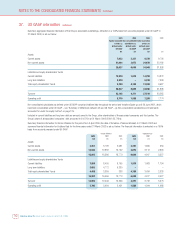
Summary aggregated financial information of the Group’s associated undertakings, extracted on a 100% basis from accounts prepared under UK GAAP to
31 March 2003, is set out below:
2003 2003 2003 2002
Equity-accounted Non-consolidated Equity-accounted
entities as subsidiaries as entities as
defined under defined under defined under
UK GAAP US GAAP US GAAP
£m £m £m £m
Assets
Current assets 7,033 2,337 9,370 9,706
Non-current assets 21,004 3,672 24,676 22,192
28,037 6,009 34,046 31,898
Liabilities and equity shareholders’ funds
Current liabilities 12,978 1,810 14,788 14,872
Long term liabilities 5,310 – 5,310 7,339
Total equity shareholders’ funds 9,749 4,199 13,948 9,687
28,037 6,009 34,046 31,898
Turnover 23,148 4,371 27,519 33,285
Operating profit 5,710 1,588 7,298 7,174
Non-consolidated subsidiaries as defined under US GAAP comprise Vodafone Italy throughout the period and Vodafone Spain up until 29 June 2001, which
have been consolidated under UK GAAP – see “Summary of differences between UK and US GAAP – (a) Non-consolidated subsidiaries and investments
accounted for under the equity method” on page 125.
Included in current liabilities and long term debt are amounts owed to the Group, other shareholders of the associated companies and third parties. The
Group’s share of all associated companies’ debt amounted to £4,276m at 31 March 2003 (2002: £5,718m).
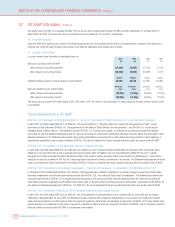
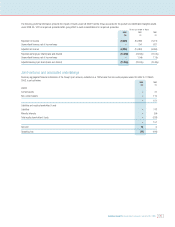
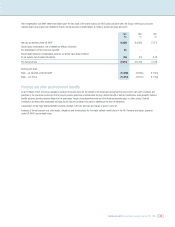
Summary financial information for Verizon Wireless for the period from 3 April 2000 (the date of formation of Verizon Wireless) to 31 March 2003 and
summary financial information for Vodafone Italy for the three years ended 31 March 2003 is set out below. The financial information is extracted on a 100%
basis from accounts prepared under UK GAAP.
Verizon Wireless Vodafone Italy
2003 2002 2001 2003 2002 2001
£m £m £m £m £m £m
Assets
Current assets 2,257 3,728 2,981 2,337 1,805 634
Non-current assets 13,645 12,838 10,792 3,672 3,112 2,893
15,902 16,566 13,773 6,009 4,917 3,527
Liabilities and equity shareholders’ funds
Current liabilities 7,809 8,405 8,105 1,810 1,483 1,194
Long term liabilities 3,605 4,772 5,330 –––
Total equity shareholders’ funds 4,488 3,389 338 4,199 3,434 2,333
15,902 16,566 13,773 6,009 4,917 3,527
Turnover 12,902 12,449 10,266 4,371 3,732 3,073
Operating profit 2,795 3,029 2,451 1,588 1,344 1,068
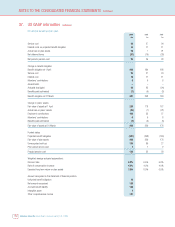
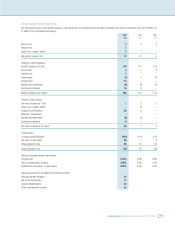
37. US GAAP information continued