Vodafone 2003 Annual Report Download - page 81
Download and view the complete annual report
Please find page 81 of the 2003 Vodafone annual report below. You can navigate through the pages in the report by either clicking on the pages listed below, or by using the keyword search tool below to find specific information within the annual report.-
 1
1 -
2
-
3
-
4
-
5
-
6
-
7
-
8
-
9
-
10
-
11
-
12
-
13
-
14
-
15
-
16
-
17
-
18
-
19
-
20
-
21
-
22
-
23
-
24
-
25
-
26
-
27
-
28
-
29
-
30
-
31
-
32
-
33
-
34
-
35
-
36
-
37
-
38
-
39
-
40
-
41
-
42
-
43
-
44
-
45
-
46
-
47
-
48
-
49
-
50
-
51
-
52
-
53
-
54
-
55
-
56
-
57
-
58
-
59
-
60
-
61
-
62
-
63
-
64
-
65
-
66
-
67
-
68
-
69
-
70
-
 71
71 -
 72
72 -
 73
73 -
 74
74 -
 75
75 -
 76
76 -
 77
77 -
 78
78 -
 79
79 -
 80
80 -
 81
81 -
 82
82 -
 83
83 -
 84
84 -
 85
85 -
 86
86 -
 87
87 -
 88
88 -
 89
89 -
 90
90 -
 91
91 -
92
-
93
-
94
-
95
-
96
-
97
-
98
-
99
-
100
-
101
-
102
-
103
-
104
-
105
-
106
-
107
-
108
-
109
-
110
-
111
-
112
-
113
-
114
-
115
-
116
-
117
-
118
-
119
-
120
-
121
-
122
-
123
-
124
-
125
-
126
-
127
-
128
-
129
-
130
-
131
-
132
-
133
-
134
-
135
-
136
-
137
-
138
-
139
-
140
-
141
-
142
-
143
-
144
-
145
-
146
-
147
-
148
-
149
-
150
-
151
-
152
-
153
-
154
-
155
 |
 |

Vodafone Group Plc Annual Report & Accounts and Form 20-F 2003 79
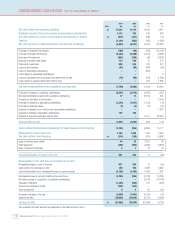
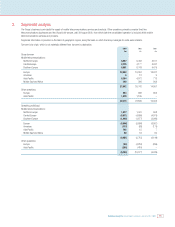
3. Segmental analysis
The Group’s business is principally the supply of mobile telecommunications services and products. Other operations primarily comprise fixed line
telecommunications businesses and the Vizzavi joint venture, until 29 August 2002, from which date the consolidated operation is included within mobile
telecommunications services and products.
Segmental information is provided on the basis of geographic regions, being the basis on which the Group manages its world-wide interests.
Turnover is by origin, which is not materially different from turnover by destination.
2003 2002 2001
£m £m £m
Group turnover
Mobile telecommunications:
Northern Europe 6,057 5,432 4,511
Central Europe 4,775 4,177 4,031
Southern Europe 8,051 6,743 4,479
Europe 18,883 16,352 13,021
Americas 512 9
Asia Pacific 8,364 4,072 713
Middle East and Africa 290 306 308
27,542 20,742 14,051
Other operations:
Europe 854 998 953
Asia Pacific 1,979 1,105 –
30,375 22,845 15,004
Operating profit/(loss)
Mobile telecommunications:
Northern Europe 1,317 1,041 968
Central Europe (5,071) (4,860) (4,975)
Southern Europe (1,842) (1,877) (2,060)
Europe (5,596) (5,696) (6,067)
Americas (117) (68) (179)
Asia Pacific 702 15 7
Middle East and Africa 60 34 95
(4,951) (5,715) (6,144)
Other operations:
Europe (89) (4,252) (295)
Asia Pacific (255) (410) –
(5,295) (10,377) (6,439)