Vodafone 2003 Annual Report Download - page 116
Download and view the complete annual report
Please find page 116 of the 2003 Vodafone annual report below. You can navigate through the pages in the report by either clicking on the pages listed below, or by using the keyword search tool below to find specific information within the annual report.-
 1
1 -
2
-
3
-
4
-
5
-
6
-
7
-
8
-
9
-
10
-
11
-
12
-
13
-
14
-
15
-
16
-
17
-
18
-
19
-
20
-
21
-
22
-
23
-
24
-
25
-
26
-
27
-
28
-
29
-
30
-
31
-
32
-
33
-
34
-
35
-
36
-
37
-
38
-
39
-
40
-
41
-
42
-
43
-
44
-
45
-
46
-
47
-
48
-
49
-
50
-
51
-
52
-
53
-
54
-
55
-
56
-
57
-
58
-
59
-
60
-
61
-
62
-
63
-
64
-
65
-
66
-
67
-
68
-
69
-
70
-
71
-
72
-
73
-
74
-
75
-
76
-
77
-
78
-
79
-
80
-
81
-
82
-
83
-
84
-
85
-
86
-
87
-
88
-
89
-
90
-
91
-
92
-
93
-
94
-
95
-
96
-
97
-
98
-
99
-
100
-
101
-
102
-
103
-
104
-
105
-
 106
106 -
 107
107 -
 108
108 -
 109
109 -
 110
110 -
 111
111 -
 112
112 -
 113
113 -
 114
114 -
 115
115 -
 116
116 -
 117
117 -
 118
118 -
 119
119 -
 120
120 -
 121
121 -
 122
122 -
 123
123 -
 124
124 -
 125
125 -
 126
126 -
127
-
128
-
129
-
130
-
131
-
132
-
133
-
134
-
135
-
136
-
137
-
138
-
139
-
140
-
141
-
142
-
143
-
144
-
145
-
146
-
147
-
148
-
149
-
150
-
151
-
152
-
153
-
154
-
155
 |
 |

Vodafone Group Plc Annual Report & Accounts and Form 20-F 2003
114
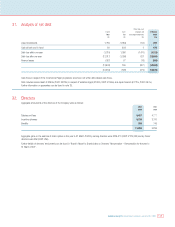
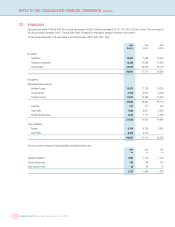
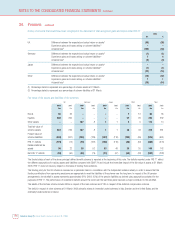
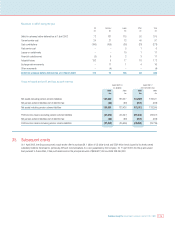
NOTES TO THE CONSOLIDATED FINANCIAL STATEMENTS Continued
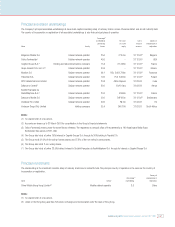
33. Employees
During the year ended 31 March 2003 the Group had an average of 66,667 full time employees (2002: 67,178, 2001: 53,325) of which 78% were based in
the Group’s mobile businesses (2002: 79% and 2000: 83%). An analysis of employee by category of activity is shown below.
Of total average employees, 15% were based in the United Kingdom (2002: 16%, 2001: 20%).
2003 2002 2001
Number Number Number
By activity:
Operations 14,863 17,658 13,963
Selling and distribution 16,252 14,068 10,642
Administration 35,552 35,452 28,720
66,667 67,178 53,325
By segment:
Mobile Telecommunications:
Northern Europe 15,579 17,763 15,210
Central Europe 9,732 8,914 8,300
Southern Europe 17,251 16,986 15,260
42,562 43,663 38,770
Americas 391 471 432
Asia Pacific 7,063 6,007 3,999
Middle East and Africa 1,819 1,771 1,485
51,835 51,912 44,686
Other operations:
Europe 6,354 9,136 8,639
Asia Pacific 8,478 6,130 –
66,667 67,178 53,325
The cost incurred in respect of these employees (including directors) was:
2003 2002 2001
£m £m £m
Wages and salaries 1,984 1,740 1,408
Social security costs 199 192 113
Other pension costs 95 64 47
2,278 1,996 1,568