Vodafone 2003 Annual Report Download - page 94
Download and view the complete annual report
Please find page 94 of the 2003 Vodafone annual report below. You can navigate through the pages in the report by either clicking on the pages listed below, or by using the keyword search tool below to find specific information within the annual report.-
 1
1 -
2
-
3
-
4
-
5
-
6
-
7
-
8
-
9
-
10
-
11
-
12
-
13
-
14
-
15
-
16
-
17
-
18
-
19
-
20
-
21
-
22
-
23
-
24
-
25
-
26
-
27
-
28
-
29
-
30
-
31
-
32
-
33
-
34
-
35
-
36
-
37
-
38
-
39
-
40
-
41
-
42
-
43
-
44
-
45
-
46
-
47
-
48
-
49
-
50
-
51
-
52
-
53
-
54
-
55
-
56
-
57
-
58
-
59
-
60
-
61
-
62
-
63
-
64
-
65
-
66
-
67
-
68
-
69
-
70
-
71
-
72
-
73
-
74
-
75
-
76
-
77
-
78
-
79
-
80
-
81
-
82
-
83
-
 84
84 -
 85
85 -
 86
86 -
 87
87 -
 88
88 -
 89
89 -
 90
90 -
 91
91 -
 92
92 -
 93
93 -
 94
94 -
 95
95 -
 96
96 -
 97
97 -
 98
98 -
 99
99 -
 100
100 -
 101
101 -
 102
102 -
 103
103 -
 104
104 -
105
-
106
-
107
-
108
-
109
-
110
-
111
-
112
-
113
-
114
-
115
-
116
-
117
-
118
-
119
-
120
-
121
-
122
-
123
-
124
-
125
-
126
-
127
-
128
-
129
-
130
-
131
-
132
-
133
-
134
-
135
-
136
-
137
-
138
-
139
-
140
-
141
-
142
-
143
-
144
-
145
-
146
-
147
-
148
-
149
-
150
-
151
-
152
-
153
-
154
-
155
 |
 |

Vodafone Group Plc Annual Report & Accounts and Form 20-F 2003
92
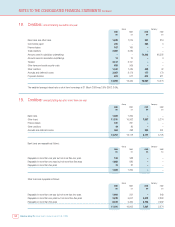
NOTES TO THE CONSOLIDATED FINANCIAL STATEMENTS Continued
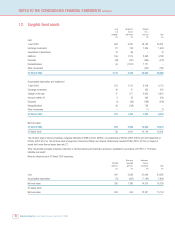
13. Fixed asset investments continued
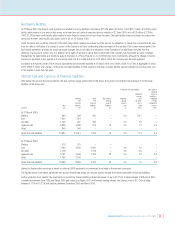
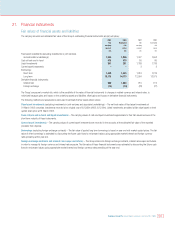
The Group’s share of its joint ventures and associated undertakings comprises:
Joint ventures Associated undertakings
2003 2002 2003 2002
£m £m £m £m
Share of turnover of joint ventures and associated undertakings 838,769 10,693
Share of assets
Fixed assets –55 8,390 7,487
Current assets –21 2,640 2,816
–76 11,030 10,303
Share of liabilities
Liabilities due within one year –372 5,261 5,136
Liabilities due after more than one year ––2,127 2,782
Minority interests –(27) 433 124
–345 7,821 8,042
Share of net (liabilities)/assets –(269) 3,209 2,261
Loans –321 –18
Attributed goodwill net of amortisation charges ––22,616 24,970
–52 25,825 27,249
Analysed as:
Fixed asset investments –321 25,825 27,249
Provisions for liabilities and charges –(269) ––
–52 25,825 27,249
The Group’s principal associated undertakings and fixed asset investments are detailed in note 36.
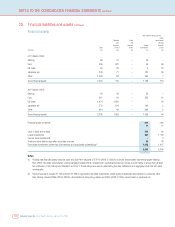
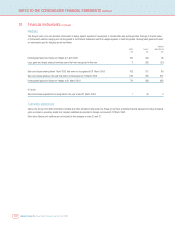
The Group’s share of turnover, profits and losses, assets and liabilities of Verizon Wireless included in the above analysis is as follows:
2003 2002
£m £m
Share of:
Turnover 5,806 5,602
Profit before taxation and goodwill amortisation 1,088 1,058
Goodwill amortisation (1,202) (1,259)
Loss on ordinary activities before taxation (114) (201)
Tax on loss on ordinary activities (71) (66)
Loss on ordinary activities after taxation (185) (267)
Fixed assets 6,140 5,777
Current assets 1,016 1,678
Liabilities due within one year (3,514) (3,782)
Liabilities due after more than one year (1,622) (2,148)
Minority interests (433) (123)
Share of net assets 1,587 1,402
Attributed goodwill net of amortisation charges 16,649 19,748
Share of net assets and attributed goodwill 18,236 21,150