Vodafone 2003 Annual Report Download - page 126
Download and view the complete annual report
Please find page 126 of the 2003 Vodafone annual report below. You can navigate through the pages in the report by either clicking on the pages listed below, or by using the keyword search tool below to find specific information within the annual report.-
 1
1 -
2
-
3
-
4
-
5
-
6
-
7
-
8
-
9
-
10
-
11
-
12
-
13
-
14
-
15
-
16
-
17
-
18
-
19
-
20
-
21
-
22
-
23
-
24
-
25
-
26
-
27
-
28
-
29
-
30
-
31
-
32
-
33
-
34
-
35
-
36
-
37
-
38
-
39
-
40
-
41
-
42
-
43
-
44
-
45
-
46
-
47
-
48
-
49
-
50
-
51
-
52
-
53
-
54
-
55
-
56
-
57
-
58
-
59
-
60
-
61
-
62
-
63
-
64
-
65
-
66
-
67
-
68
-
69
-
70
-
71
-
72
-
73
-
74
-
75
-
76
-
77
-
78
-
79
-
80
-
81
-
82
-
83
-
84
-
85
-
86
-
87
-
88
-
89
-
90
-
91
-
92
-
93
-
94
-
95
-
96
-
97
-
98
-
99
-
100
-
101
-
102
-
103
-
104
-
105
-
106
-
107
-
108
-
109
-
110
-
111
-
112
-
113
-
114
-
115
-
 116
116 -
 117
117 -
 118
118 -
 119
119 -
 120
120 -
 121
121 -
 122
122 -
 123
123 -
 124
124 -
 125
125 -
 126
126 -
 127
127 -
 128
128 -
 129
129 -
 130
130 -
 131
131 -
 132
132 -
 133
133 -
 134
134 -
 135
135 -
 136
136 -
137
-
138
-
139
-
140
-
141
-
142
-
143
-
144
-
145
-
146
-
147
-
148
-
149
-
150
-
151
-
152
-
153
-
154
-
155
 |
 |

Vodafone Group Plc Annual Report & Accounts and Form 20-F 2003
124
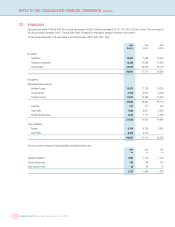
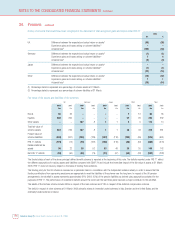
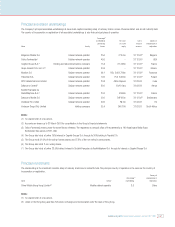
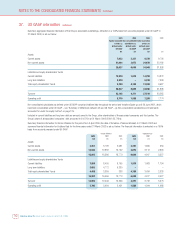
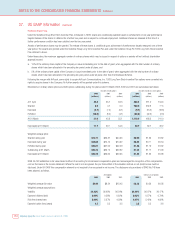
NOTES TO THE CONSOLIDATED FINANCIAL STATEMENTS Continued
As at 31 March 2002, this restatement had the effect of reducing goodwill and other intangibles – net of amortisation by £22,740m, decreasing the
net liability in relation to income taxes by £18,919m with a corresponding increase in investments accounted for under the equity method of £3,821m.
In the year ended 31 March 2001, this restatement had the effect of reducing goodwill and other intangibles amortisation by £2,184m, decreasing the
net credit in relation to income taxes by £3,356m with a corresponding increase in the net loss from investments accounted for under the equity
method of £1,172m.
This restatement does not affect previously reported US GAAP net loss for the two years ended 31 March 2002 or US GAAP shareholders’ equity at
31 March 2002.
(3) Change in accounting principle for 2002 relates to the Group’s transitional adjustment in respect of the adoption of SFAS No. 133, “Accounting for
Derivative Instruments and Hedging Activities”, on 1 April 2001. The adjustment in respect of SFAS No. 133 for the year ended 31 March 2002 is
included within “Items (increasing)/decreasing net loss: Other”and increased the US GAAP net loss by £38m.
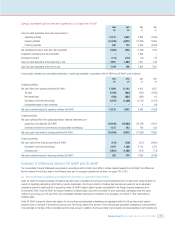
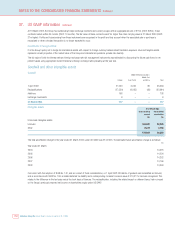
(4) Further analysis as to how amounts presented for goodwill and other intangibles – net of amortisation as at 31 March 2003 and 31 March 2002 have
been determined is provided below.
2003 2003 2002
$m £m £m
Use of a different measurement date for the purposes of determining purchase consideration 8,219 5,205 4,086
Deferred tax 72,931 46,188 23,939
Other 9,450 5,985 11,000
90,600 57,378 39,025
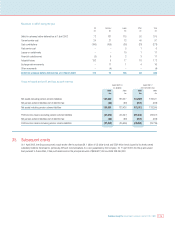
Comprehensive income
SFAS No. 130, “Reporting Comprehensive Income”, requires that all items that are required to be recognised as components of comprehensive income be
reported in a separate financial statement. There are no material differences between total recognised gains and losses for the financial year shown in the
Statement of Total Recognised Gains and Losses presented under UK GAAP and US GAAP comprehensive income, except for the differences between UK and
US GAAP net income shown above.
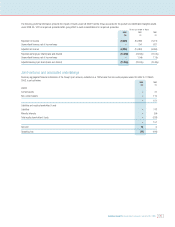
Consolidated statements of cash flows
The consolidated statements of cash flows prepared under UK GAAP differ in certain presentational respects from the format required under SFAS No. 95,
“Statement of Cash Flows”. Under SFAS No. 95, the Group experienced an outflow of cash and cash equivalents of £1,103m during the year ended
31 March 2003. Under FRS1, “Cash flow statements (revised)”, the Group experienced an inflow of cash of £393m over the same period.
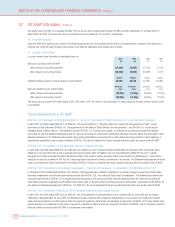
Cash equivalents are defined as short term, highly liquid investments which are readily convertible into known amounts of cash without notice and which
were within three months of maturity when acquired.
The following table summarises the movement and composition of cash and cash equivalents under US GAAP for the three years ended 31 March 2003,
2002 and 2001.
37. US GAAP information continued