Vodafone 2003 Annual Report Download - page 11
Download and view the complete annual report
Please find page 11 of the 2003 Vodafone annual report below. You can navigate through the pages in the report by either clicking on the pages listed below, or by using the keyword search tool below to find specific information within the annual report.-
 1
1 -
 2
2 -
 3
3 -
 4
4 -
 5
5 -
 6
6 -
 7
7 -
 8
8 -
 9
9 -
 10
10 -
 11
11 -
 12
12 -
 13
13 -
 14
14 -
 15
15 -
 16
16 -
 17
17 -
 18
18 -
 19
19 -
 20
20 -
 21
21 -
 22
22 -
23
-
24
-
25
-
26
-
27
-
28
-
29
-
30
-
31
-
32
-
33
-
34
-
35
-
36
-
37
-
38
-
39
-
40
-
41
-
42
-
43
-
44
-
45
-
46
-
47
-
48
-
49
-
50
-
51
-
52
-
53
-
54
-
55
-
56
-
57
-
58
-
59
-
60
-
61
-
62
-
63
-
64
-
65
-
66
-
67
-
68
-
69
-
70
-
71
-
72
-
73
-
74
-
75
-
76
-
77
-
78
-
79
-
80
-
81
-
82
-
83
-
84
-
85
-
86
-
87
-
88
-
89
-
90
-
91
-
92
-
93
-
94
-
95
-
96
-
97
-
98
-
99
-
100
-
101
-
102
-
103
-
104
-
105
-
106
-
107
-
108
-
109
-
110
-
111
-
112
-
113
-
114
-
115
-
116
-
117
-
118
-
119
-
120
-
121
-
122
-
123
-
124
-
125
-
126
-
127
-
128
-
129
-
130
-
131
-
132
-
133
-
134
-
135
-
136
-
137
-
138
-
139
-
140
-
141
-
142
-
143
-
144
-
145
-
146
-
147
-
148
-
149
-
150
-
151
-
152
-
153
-
154
-
155
 |
 |

Vodafone Group Plc Annual Report & Accounts and Form 20-F 2003 9
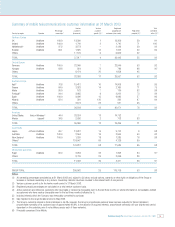
Summary of mobile telecommunications customer information at 31 March 2003
Venture Venture Registered Total
Percentage customers customer proportionate Registered controlled
Country by region Operator ownership(1) (thousands) growth (%)(2) customers (thousands) prepaid (%)(3) active (%)(4)
Northern Europe
UK Vodafone 100.0 13,300 1 13,300 59 91
Ireland Vodafone 100.0 1,740 2 1,740 71 100
Netherlands(5) Vodafone 97.2 3,273 – 3,183 59 93
Sweden Vodafone 99.1 1,325 14 1,313 30 95
Others 17,579 6 6,909 52
TOTAL 37,217 4 26,445 55 92
Central Europe
Germany Vodafone 100.0 22,940 7 22,940 53 92
Hungary Vodafone 83.8 954 72 799 88 90†
Others 8,474 20 1,858 45
TOTAL 32,368 11 25,597 52 92
Southern Europe
Italy(6) Vodafone 76.8 19,412 10 14,908 92 95
Greece Vodafone 64.0 3,383 14 2,166 71 75
Malta Vodafone 80.0 163 7 130 92 98
Portugal(5) Vodafone 94.4 3,085 9 2,912 73 88
Spain Vodafone 100.0 9,096 15 9,096 57 96
Albania Vodafone 82.4 391 130 322 97 94
Others 2,673 23 537 65
TOTAL 38,203 13 30,071 78 93
Americas
United States Verizon Wireless(7) 44.4 33,324 13 14,792 7
Mexico Iusacell 34.5 2,036 2 703 83
TOTAL 35,360 12 15,495 11
Asia Pacific
Japan J-Phone Vodafone 69.7 13,912 14 9,702 6 98
Australia Vodafone 100.0 2,564 19 2,564 50 93
New Zealand Vodafone 100.0 1,289 18 1,289 78 98
Others(8) 124,047 66 4,129 60
TOTAL 141,812 58 17,684 55 98
Middle East and Africa
Egypt Vodafone 60.0 2,263 32 1,358 84 97†
Others 8,739 25 3,059 86
TOTAL 11,002 26 4,417 86 97
GROUP TOTAL 295,962 29 119,709 53 93
Notes:
(1) All ownership percentages are stated as at 31 March 2003 and, subject to (5) below, exclude options, warrants or other rights or obligations of the Group to
increase or decrease ownership in any venture. Ownership interests have been rounded to the nearest tenth of one percent.
(2) Venture customer growth is for the twelve month period to 31 March 2003.
(3) Registered prepaid percentages are calculated on a total venture customer basis.
(4) Active customers are defined as customers who have made or received a chargeable event in the last three months or, where information is not available, defined
as customers who have made a chargeable event in the last three months (indicated by †).
(5) Includes interests which the Company was irrevocably committed to purchase.
(6) Italy migrated to the single Vodafone brand in May 2003.
(7) The Group’s ownership interest in Verizon Wireless is 45.0%. However, the Group’s proportionate customer base has been adjusted for Verizon Wireless’s
proportionate ownership of its customer base of approximately 98.6%. In the absence of acquired interests, proportionate ownership will vary slightly each period
dependent on the underlying mix of net additions across each of these networks.
(8) Principally comprises China Mobile.