Vodafone 2003 Annual Report Download - page 33
Download and view the complete annual report
Please find page 33 of the 2003 Vodafone annual report below. You can navigate through the pages in the report by either clicking on the pages listed below, or by using the keyword search tool below to find specific information within the annual report.-
 1
1 -
2
-
3
-
4
-
5
-
6
-
7
-
8
-
9
-
10
-
11
-
12
-
13
-
14
-
15
-
16
-
17
-
18
-
19
-
20
-
21
-
22
-
 23
23 -
 24
24 -
 25
25 -
 26
26 -
 27
27 -
 28
28 -
 29
29 -
 30
30 -
 31
31 -
 32
32 -
 33
33 -
 34
34 -
 35
35 -
 36
36 -
 37
37 -
 38
38 -
 39
39 -
 40
40 -
 41
41 -
 42
42 -
 43
43 -
44
-
45
-
46
-
47
-
48
-
49
-
50
-
51
-
52
-
53
-
54
-
55
-
56
-
57
-
58
-
59
-
60
-
61
-
62
-
63
-
64
-
65
-
66
-
67
-
68
-
69
-
70
-
71
-
72
-
73
-
74
-
75
-
76
-
77
-
78
-
79
-
80
-
81
-
82
-
83
-
84
-
85
-
86
-
87
-
88
-
89
-
90
-
91
-
92
-
93
-
94
-
95
-
96
-
97
-
98
-
99
-
100
-
101
-
102
-
103
-
104
-
105
-
106
-
107
-
108
-
109
-
110
-
111
-
112
-
113
-
114
-
115
-
116
-
117
-
118
-
119
-
120
-
121
-
122
-
123
-
124
-
125
-
126
-
127
-
128
-
129
-
130
-
131
-
132
-
133
-
134
-
135
-
136
-
137
-
138
-
139
-
140
-
141
-
142
-
143
-
144
-
145
-
146
-
147
-
148
-
149
-
150
-
151
-
152
-
153
-
154
-
155
 |
 |

Vodafone Group Plc Annual Report & Accounts and Form 20-F 2003 31
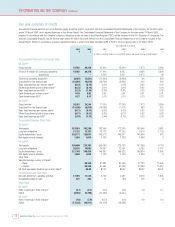
Operating Results
The statutory consolidated profit and loss account presented on page 72, and the accompanying notes, have been prepared on the basis required by UK GAAP and are
summarised below.
Years ended 31 March
2003 2002 2001
£m £m £m
Income and expense items
Turnover 30,375 22,845 15,004
Cost of sales, selling, distribution and administrative expenses
(including goodwill amortisation) (35,670) (33,222) (21,443)
Operating loss (5,295) (10,377) (6,439)
Share of loss of joint ventures and associated undertakings (156) (1,457) (550)
Total Group operating loss (5,451) (11,834) (6,989)
Total Group operating profit, before goodwill amortisation
and exceptional items 9,181 7,044 5,204
Goodwill amortisation (14,056) (13,470) (11,873)
Exceptional operating costs (576) (5,408) (320)
(5,451) (11,834) (6,989)
Exceptional non-operating items (5) (860) 80
Net interest expense (752) (845) (1,177)
Taxation (2,956) (2,140) (1,426)
Loss on ordinary activities after taxation (9,164) (15,679) (9,512)
Loss for the financial year (9,819) (16,155) (9,885)
2003 financial year compared to 2002 financial
year
Turnover
Turnover increased 33% in the 2003 financial year. Growth from existing
operations was £2,440 million, an increase of 11%, and growth in respect of
acquired businesses was £5,090 million, mainly comprising J-Phone Vodafone
and Japan Telecom, which both became subsidiaries from October 2001.
Changes in exchange rates also beneficially impacted the reported growth in
total turnover as a result of a stronger euro partly offset by a weaker yen.
Translating the results of overseas companies at exchange rates prevailing in the
prior year would reduce reported growth by £171 million.
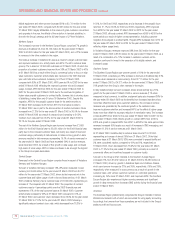
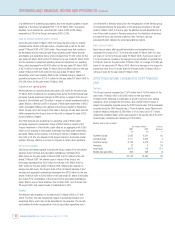
Mobile telecommunications
Year ended 31 March Increase/
2003 2002 (decrease)
£m £m %
Northern Europe 6,057 5,432 12
Central Europe 4,775 4,177 14
Southern Europe 8,051 6,743 19
Americas 512 (58)
Asia Pacific 8,364 4,072 105
Middle East and Africa 290 306 (5)
27,542 20,742 33
The £6,800 million increase in turnover from mobile telecommunications
comprises £2,584 million growth from existing operations and £4,216 million
from the full year inclusion of J-Phone Vodafone. Mobile service revenue
increased 32% to £24,823 million for the 2003 financial year, as a result of
greater usage of voice services, increased penetration of data products and
services and the benefit of a full year’s service revenues from J-Phone Vodafone.
Revenues from voice services for the year ended 31 March 2003 were £21,201
million, representing an increase of 27% over the comparable period. The Group
achieved a sustained improvement in ARPU in many key markets in Europe,
compared with the year ended 31 March 2002, as benefits from the Group’s
continued focus on high value customers led to increased penetration of the
contract customer segment and initiatives to stimulate usage, including the
launch of new and innovative products, were realised.
Another key driver of the growth in turnover and improved ARPU position was the
continued success of the Group’s data product and service offerings. Revenues
from data services increased 73% to £3,622 million for the year ended
31 March 2003 from £2,093 million for the year ended 31 March 2002, to
represent 14.6% of service revenues in the Group’s controlled mobile
subsidiaries, compared with 11.1% for the 2002 financial year. See “Data
revenues”below for further discussion.
Mobile service revenue growth was adversely affected both by reductions in
interconnect rates in a number of the Group’s markets, mainly in Europe, and the
effect of increased competitive activity in certain key European markets by
existing competitors looking to attract market share and generate customer
loyalty.