Vodafone 2003 Annual Report Download - page 44
Download and view the complete annual report
Please find page 44 of the 2003 Vodafone annual report below. You can navigate through the pages in the report by either clicking on the pages listed below, or by using the keyword search tool below to find specific information within the annual report.-
 1
1 -
2
-
3
-
4
-
5
-
6
-
7
-
8
-
9
-
10
-
11
-
12
-
13
-
14
-
15
-
16
-
17
-
18
-
19
-
20
-
21
-
22
-
23
-
24
-
25
-
26
-
27
-
28
-
29
-
30
-
31
-
32
-
33
-
 34
34 -
 35
35 -
 36
36 -
 37
37 -
 38
38 -
 39
39 -
 40
40 -
 41
41 -
 42
42 -
 43
43 -
 44
44 -
 45
45 -
 46
46 -
 47
47 -
 48
48 -
 49
49 -
 50
50 -
 51
51 -
 52
52 -
 53
53 -
 54
54 -
55
-
56
-
57
-
58
-
59
-
60
-
61
-
62
-
63
-
64
-
65
-
66
-
67
-
68
-
69
-
70
-
71
-
72
-
73
-
74
-
75
-
76
-
77
-
78
-
79
-
80
-
81
-
82
-
83
-
84
-
85
-
86
-
87
-
88
-
89
-
90
-
91
-
92
-
93
-
94
-
95
-
96
-
97
-
98
-
99
-
100
-
101
-
102
-
103
-
104
-
105
-
106
-
107
-
108
-
109
-
110
-
111
-
112
-
113
-
114
-
115
-
116
-
117
-
118
-
119
-
120
-
121
-
122
-
123
-
124
-
125
-
126
-
127
-
128
-
129
-
130
-
131
-
132
-
133
-
134
-
135
-
136
-
137
-
138
-
139
-
140
-
141
-
142
-
143
-
144
-
145
-
146
-
147
-
148
-
149
-
150
-
151
-
152
-
153
-
154
-
155
 |
 |

Vodafone Group Plc Annual Report & Accounts and Form 20-F 2003
42
OPERATING AND FINANCIAL REVIEW AND PROSPECTS Continued
US GAAP reconciliation
Net loss under US GAAP for the year ended 31 March 2003 was £9,055 million
(2002: £16,688 million). This compares with a net loss of £9,819 million (2002:
£16,155 million) under UK GAAP. The principal differences between US GAAP
and UK GAAP, as they relate to the determination of net loss, are the methods of
accounting for acquisitions, capitalisation of interest and taxation.
In the year to 31 March 2003, revenues under US GAAP were £24,244 million
compared with revenues under UK GAAP of £30,375 million. In the year to
31 March 2002, revenues under US GAAP were £17,639 million compared with
revenues under UK GAAP of £22,845 million. The difference in both periods
relates primarily to the non-consolidation of subsidiaries, being Vodafone Italy
and Vodafone Spain until 29 June 2001, the date of completion of the Group’s
acquisition of a further 17.8% shareholding in Vodafone Spain, following which
Vodafone Spain was fully consolidated under both US GAAP and UK GAAP. For
both undertakings, the existence of significant participating rights of minority
shareholders has required the equity method of accounting to be adopted under
US GAAP rather than the full consolidation of results under UK GAAP. This has
not affected the net income of the Group.
For a further explanation of the differences between UK GAAP and US GAAP,
including a summary of the impact of recently issued US accounting standards,
see note 37 to the Consolidated Financial Statements, “US GAAP information”.
Liquidity and Capital Resources
Cash flows and funding
The major sources of Group liquidity over the three years ended 31 March 2003
have been cash generated from operations, borrowings through long term and
short term issuance in the capital markets, borrowings drawn from committed
bank facilities, monetisation of assets, asset disposals and, for the year ended
31 March 2002 only, the proceeds from a share issuance. The Group does not
use off-balance sheet special purpose entities as a source of liquidity or for other
financing purposes.
The Group’s key sources of liquidity for the foreseeable future are likely to be
cash generated from operations and borrowings through long term and short
term issuances in the capital markets as well as committed bank facilities. The
Group’s liquidity and working capital may be affected by a material decrease in
cash flow due to factors such as increased competition, litigation, timing of tax
payments, regulatory rulings, delays in development of new services and
networks, or inability to receive expected revenues from the introduction of new
services. See “Risk Factors”elsewhere in this document.
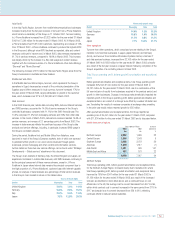
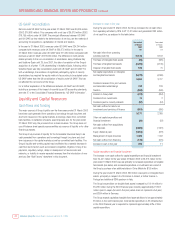
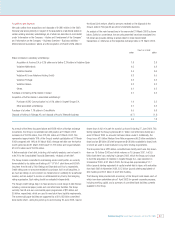
Increase in cash in the year
During the year ended 31 March 2003, the Group increased its net cash inflow
from operating activities by 38% to £11,142 million and generated £393 million
of net cash flow, as analysed in the table below:
31 March
2003
Year ended Year ended
31 March 31 March
2003 2002
£m £m
Net cash inflow from operating
activities (note 30) 11,142 8,102
Purchase of intangible fixed assets (99) (325)
Purchase of tangible fixed assets (5,289) (4,145)
Disposal of tangible fixed assets 109 75
Net capital expenditure on intangible
and tangible fixed assets (5,279) (4,395)
5,863 3,707
Dividends received from joint ventures
and associated undertakings 742 139
Taxation (883) (545)
Interest on Group debt (475) (854)
Dividends from investments 15 2
Dividends paid to minority interests (91) (84)
Net cash outflow for returns on
investments and servicing of finance (551) (936)
5,171 2,365
Other net capital expenditure and
financial investment (94) (52)
Net cash outflow from acquisitions
and disposals (4,880) (7,691)
Equity dividends paid (1,052) (978)
Management of liquid resources 1,384 7,042
Net cash outflow from financing (136) (675)
Increase in cash in the year 393 11
Capital expenditure and financial investment
The increase in net cash outflow for capital expenditure and financial investment
from £4,447 million for the year ended 31 March 2002 to £5,373 million for the
year ended 31 March 2003 was due primarily to increased expenditure on tangible
fixed assets (see below) and increased expenditure on investments as a result of
the Group’s purchase of an additional stake in China Mobile for $750 million.
During the year ended 31 March 2003, £99 million was spent on intangible fixed
assets, principally in respect of a 3G licence in Ireland, a further licence in
Portugal and additional GSM spectrum in Italy.
The Group’s expenditure on tangible fixed assets increased by £1,144 million to
£5,289 million during the 2003 financial year, including approximately £1,861
million spent in Japan (for which the prior period does not represent a full year)
and £894 million in Germany.
The Group expects capitalised tangible fixed asset additions to be approximately
£5 billion in the next financial year. Incremental expenditure on 3G infrastructure
in the 2004 financial year is expected to represent approximately 40% of total
capital expenditure.