Vodafone 2003 Annual Report Download - page 102
Download and view the complete annual report
Please find page 102 of the 2003 Vodafone annual report below. You can navigate through the pages in the report by either clicking on the pages listed below, or by using the keyword search tool below to find specific information within the annual report.-
 1
1 -
2
-
3
-
4
-
5
-
6
-
7
-
8
-
9
-
10
-
11
-
12
-
13
-
14
-
15
-
16
-
17
-
18
-
19
-
20
-
21
-
22
-
23
-
24
-
25
-
26
-
27
-
28
-
29
-
30
-
31
-
32
-
33
-
34
-
35
-
36
-
37
-
38
-
39
-
40
-
41
-
42
-
43
-
44
-
45
-
46
-
47
-
48
-
49
-
50
-
51
-
52
-
53
-
54
-
55
-
56
-
57
-
58
-
59
-
60
-
61
-
62
-
63
-
64
-
65
-
66
-
67
-
68
-
69
-
70
-
71
-
72
-
73
-
74
-
75
-
76
-
77
-
78
-
79
-
80
-
81
-
82
-
83
-
84
-
85
-
86
-
87
-
88
-
89
-
90
-
91
-
 92
92 -
 93
93 -
 94
94 -
 95
95 -
 96
96 -
 97
97 -
 98
98 -
 99
99 -
 100
100 -
 101
101 -
 102
102 -
 103
103 -
 104
104 -
 105
105 -
 106
106 -
 107
107 -
 108
108 -
 109
109 -
 110
110 -
 111
111 -
 112
112 -
113
-
114
-
115
-
116
-
117
-
118
-
119
-
120
-
121
-
122
-
123
-
124
-
125
-
126
-
127
-
128
-
129
-
130
-
131
-
132
-
133
-
134
-
135
-
136
-
137
-
138
-
139
-
140
-
141
-
142
-
143
-
144
-
145
-
146
-
147
-
148
-
149
-
150
-
151
-
152
-
153
-
154
-
155
 |
 |

Vodafone Group Plc Annual Report & Accounts and Form 20-F 2003
100
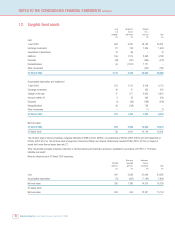
NOTES TO THE CONSOLIDATED FINANCIAL STATEMENTS Continued
Financial assets
Non-interest bearing assets
Other
Floating Fixed non-interest
rate rate bearing
financial financial Equity financial
Total assets(1) assets investments assets
Currency £m £m £m £m £m
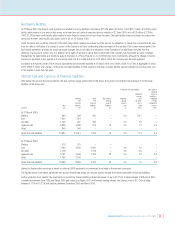
At 31 March 2003:
Sterling 99 70 – 29 –
Euro 636 528 – 49 59
US dollar 50 29 –318
Japanese yen 240 71 – 134 35
Other 1,029 68 – 954 7
Gross financial assets 2,054 766 – 1,169 119
At 31 March 2002:
Sterling 84 49 – 35 –
Euro 367 20 – 335 12
US dollar 1,674 1,650 ––24
Japanese yen 270 104 – 164 2
Other 914 46 – 862 6
Gross financial assets 3,309 1,869 – 1,396 44
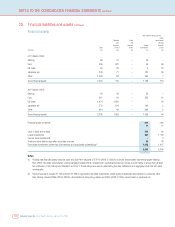
Financial assets comprise: 2003 2002
£m £m
Cash in hand and at bank 475 80
Liquid investments 291 1,789
Current asset investments –3
Trade and other debtors due after more than one year 83 30
Fixed asset investments (other than joint ventures and associated undertakings)(2) 1,205 1,407
2,054 3,309
Notes:
(1) Floating rate financial assets comprise cash and short term deposits of £761m (2002: £1,865m) and euro denominated commercial paper totalling
£5m (2002: US dollar denominated commercial paper totalling £4m), invested with counterparties having a single-A credit rating or above from at least
two of Moody’s, Fitch Ratings and Standard and Poor’s. These ratings are used in determining the daily settlement and aggregate credit risk with each
counterparty.
(2) Equity investments include £1,100m (2002: £1,333m) represented by listed investments. Listed equity investments denominated in currencies other
than sterling include £939m (2002: £848m) denominated in Hong Kong dollars and £86m (2002: £115m) denominated in Japanese yen.
20. Financial liabilities and assets continued