Vodafone 2003 Annual Report Download - page 37
Download and view the complete annual report
Please find page 37 of the 2003 Vodafone annual report below. You can navigate through the pages in the report by either clicking on the pages listed below, or by using the keyword search tool below to find specific information within the annual report.-
 1
1 -
2
-
3
-
4
-
5
-
6
-
7
-
8
-
9
-
10
-
11
-
12
-
13
-
14
-
15
-
16
-
17
-
18
-
19
-
20
-
21
-
22
-
23
-
24
-
25
-
26
-
 27
27 -
 28
28 -
 29
29 -
 30
30 -
 31
31 -
 32
32 -
 33
33 -
 34
34 -
 35
35 -
 36
36 -
 37
37 -
 38
38 -
 39
39 -
 40
40 -
 41
41 -
 42
42 -
 43
43 -
 44
44 -
 45
45 -
 46
46 -
 47
47 -
48
-
49
-
50
-
51
-
52
-
53
-
54
-
55
-
56
-
57
-
58
-
59
-
60
-
61
-
62
-
63
-
64
-
65
-
66
-
67
-
68
-
69
-
70
-
71
-
72
-
73
-
74
-
75
-
76
-
77
-
78
-
79
-
80
-
81
-
82
-
83
-
84
-
85
-
86
-
87
-
88
-
89
-
90
-
91
-
92
-
93
-
94
-
95
-
96
-
97
-
98
-
99
-
100
-
101
-
102
-
103
-
104
-
105
-
106
-
107
-
108
-
109
-
110
-
111
-
112
-
113
-
114
-
115
-
116
-
117
-
118
-
119
-
120
-
121
-
122
-
123
-
124
-
125
-
126
-
127
-
128
-
129
-
130
-
131
-
132
-
133
-
134
-
135
-
136
-
137
-
138
-
139
-
140
-
141
-
142
-
143
-
144
-
145
-
146
-
147
-
148
-
149
-
150
-
151
-
152
-
153
-
154
-
155
 |
 |

Vodafone Group Plc Annual Report & Accounts and Form 20-F 2003 35
gaining and retaining high-value customers in the most cost-efficient manner.
Inclusive of J-Phone Vodafone, equipment costs and financial incentives
amounted to 21.1% of turnover from mobile telecommunications, as costs to
connect and retain customers, although reducing, remain higher in Japan than in
the Group’s other key markets.
Consolidated sales and administrative expenses, excluding goodwill
amortisation and exceptional items
Consolidated sales and administrative expenses, excluding goodwill amortisation
and exceptional items, increased from £4,328 million, or 18.9% of turnover, for
the year ended 31 March 2002 to £5,403 million, or 17.8% of turnover, for the
year ended 31 March 2003, the increase being almost entirely attributable to the
effects of the full year inclusion of J-Phone Vodafone and Japan Telecom.
Depreciation increased by £1,099 million for the year ended 31 March 2002 to
£3,979 million for the year ended 31 March 2003 primarily as a result of the full
year inclusion of J-Phone Vodafone and Japan Telecom. In Japan, depreciation
also increased as a result of a charge in respect of its UMTS network, which was
opened for commercial service in December 2002, and in Germany, depreciation
increased as a result of the prior year expenditure on network infrastructure
improvements.
Operating loss
The total Group operating loss of £5,451 million for the year ended
31 March 2003 compares with a total Group operating loss of £11,834 million
for the year ended 31 March 2002. The results for the year ended 31 March
2003 are stated after goodwill amortisation charges of £14,056 million
compared to £13,470 million for the year ended 31 March 2002, and after
charging exceptional operating costs of £576 million compared to £5,408 million
for the year ended 31 March 2002.
Goodwill amortisation
The charge for goodwill amortisation increased from £13,470 million for the year
ended 31 March 2002 to £14,056 million for the year ended 31 March 2003 as
a result of a full year’s charge for prior year acquisitions, charges in respect of
current year acquisitions and the impact of foreign exchange. These charges for
goodwill amortisation do not affect the cash flows of the Group or the ability of
the Company to pay dividends.
Exceptional operating items
Exceptional operating costs of £576 million for the year ended 31 March 2003
comprise impairment charges of £405 million and £80 million for the Group’s
interest in Japan Telecom and Iusacell, respectively. The remaining exceptional
operating items reflect additional costs incurred as a result of the integration of
Vizzavi into the Group, following the acquisition of the remaining 50% interest in
August 2002, and related restructuring of the Group’s Global mobile platform
business.
For the 2002 financial year, exceptional operating costs of £5,408 million
comprised impairment charges of £5,100 million in relation to the carrying value
of goodwill for Arcor, Cegetel, Iusacell and Japan Telecom, and £222 million
representing the Group’s share of exceptional items of its associated
undertakings and joint ventures, comprising £107 million of, principally, asset
write downs in J-Phone Vodafone and £115 million of reorganisation costs in
Verizon Wireless and Vizzavi. A further £86 million of reorganisation costs was
also incurred in the 2002 financial year, principally in respect of the Group’s
operations in Australia and the UK.
In accordance with applicable accounting standards, the Group regularly
monitors the carrying value of its fixed assets. A review was undertaken at
31 March 2003 to assess whether the carrying value of assets was supported by
the net present value of future cash flows derived from assets using cash flow
projections for each asset in respect of the period to 31 March 2013.
Cash flow projections for the mobile businesses reflect investment in network
infrastructure to provide enhanced voice services and a platform for new data
products and services, enabled by GPRS and 3G technologies, which are forecast
to be significant drivers of future revenue growth. Capital expenditure is heaviest
in the early years of the projections but in most countries is expected to fall to
below 10% of revenues by the year ended 31 March 2008. Revenue growth is
forecast from a combination of new customers and richer customer propositions.
Data revenue is expected to increase significantly to 2009 but grow at more
modest rates to 2013. Voice ARPU is forecast to benefit in the longer term from
new services and traffic moving from fixed networks to mobile networks following
a period of stabilisation reflecting the impact of price declines.
Accordingly, the directors believe that it is appropriate to use projections in
excess of five years as growth in cash flows for the period to 31 March 2013 is
expected to exceed relevant country growth in nominal GDP.
For the years beyond 1 April 2013, forecast growth rates at nominal GDP have
been assumed for mobile businesses and below nominal GDP for non-mobile
businesses. The discount rates for the major markets reviewed were based on
company specific pre-tax weighted average cost of capital percentages and
ranged from 7.5% to 10.0% for mobile businesses.
In respect of the Group’s investment in China Mobile the review assessed the
carrying value against external analysts’ price targets.
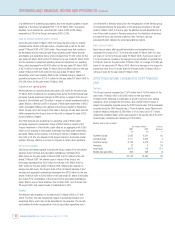
The results of the review indicated that, whilst no impairment charge was
necessary in respect of the Group’s controlled mobile businesses, impairment
charges totalling £810 million were necessary in respect of non-controlled
mobile and non-mobile businesses as detailed below.
2003
Company £m
Japan Telecom 430
Iusacell 80
China Mobile 300
810
The charge in respect of China Mobile and £25 million of the charge for Japan
Telecom are included within non-operating exceptional items.
Pension costs
The Group operates a number of pension schemes for the benefit of its
employees throughout the world. The Group accounts for its pension schemes
under SSAP 24, “Accounting for pension costs”, and provides additional
disclosures as required by FRS 17, “Retirement benefits”. A charge of £95
million has been made in the profit and loss account during the year ended
31 March 2003 (2002: £64 million) in respect of these schemes. During the
year ended 31 March 2003 the Group contributed £273 million into funded
pensions schemes, including £100 million into the German schemes which were
substantially unfunded prior to 31 March 2002. At 31 March 2003 net pension
liabilities, net of deferred tax, totalled £35 million (2002: £99 million),
representing less than 0.1% of the Group’s net assets (2002: less than 0.1%).
SSAP 24 is due to be replaced by FRS 17, or its international equivalent –
International Accounting Standard 19, “Employee Benefits”, and is expected to
first become effective for the Group in the 2006 financial year. The bases of
calculation under FRS 17 are significantly different to SSAP 24, requiring the use