Vodafone 2003 Annual Report Download - page 82
Download and view the complete annual report
Please find page 82 of the 2003 Vodafone annual report below. You can navigate through the pages in the report by either clicking on the pages listed below, or by using the keyword search tool below to find specific information within the annual report.-
 1
1 -
2
-
3
-
4
-
5
-
6
-
7
-
8
-
9
-
10
-
11
-
12
-
13
-
14
-
15
-
16
-
17
-
18
-
19
-
20
-
21
-
22
-
23
-
24
-
25
-
26
-
27
-
28
-
29
-
30
-
31
-
32
-
33
-
34
-
35
-
36
-
37
-
38
-
39
-
40
-
41
-
42
-
43
-
44
-
45
-
46
-
47
-
48
-
49
-
50
-
51
-
52
-
53
-
54
-
55
-
56
-
57
-
58
-
59
-
60
-
61
-
62
-
63
-
64
-
65
-
66
-
67
-
68
-
69
-
70
-
71
-
 72
72 -
 73
73 -
 74
74 -
 75
75 -
 76
76 -
 77
77 -
 78
78 -
 79
79 -
 80
80 -
 81
81 -
 82
82 -
 83
83 -
 84
84 -
 85
85 -
 86
86 -
 87
87 -
 88
88 -
 89
89 -
 90
90 -
 91
91 -
 92
92 -
93
-
94
-
95
-
96
-
97
-
98
-
99
-
100
-
101
-
102
-
103
-
104
-
105
-
106
-
107
-
108
-
109
-
110
-
111
-
112
-
113
-
114
-
115
-
116
-
117
-
118
-
119
-
120
-
121
-
122
-
123
-
124
-
125
-
126
-
127
-
128
-
129
-
130
-
131
-
132
-
133
-
134
-
135
-
136
-
137
-
138
-
139
-
140
-
141
-
142
-
143
-
144
-
145
-
146
-
147
-
148
-
149
-
150
-
151
-
152
-
153
-
154
-
155
 |
 |

Vodafone Group Plc Annual Report & Accounts and Form 20-F 2003
80
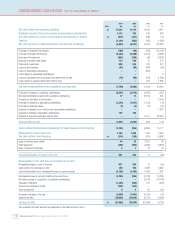
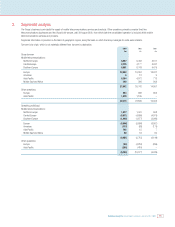
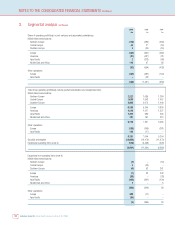
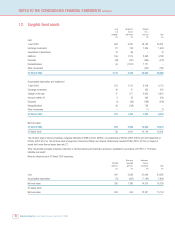
NOTES TO THE CONSOLIDATED FINANCIAL STATEMENTS Continued
3. Segmental analysis continued
2003 2002 2001
£m £m £m
Share of operating profit/(loss) in joint ventures and associated undertakings
Mobile telecommunications:
Northern Europe (170) (284) (350)
Central Europe 44 27 (16)
Southern Europe 3(94) (16)
Europe (123) (351) (382)
Americas (21) (487) (31)
Asia Pacific 2(213) (99)
Middle East and Africa 110 97 86
(32) (954) (426)
Other operations:
Europe (124) (481) (124)
Asia Pacific –(22) –
(156) (1,457) (550)
Total Group operating profit/(loss), before goodwill amortisation and exceptional items
Mobile telecommunications:
Northern Europe 2,222 1,685 1,284
Central Europe 1,616 1,543 1,097
Southern Europe 2,495 2,072 1,449
Europe 6,333 5,300 3,830
Americas 1,219 1,317 1,237
Asia Pacific 1,421 589 205
Middle East and Africa 197 161 213
9,170 7,367 5,485
Other operations:
Europe (138) (306) (281)
Asia Pacific 149 (17) –
9,181 7,044 5,204
Goodwill amortisation (14,056) (13,470) (11,873)
Exceptional operating items (note 4) (576) (5,408) (320)
(5,451) (11,834) (6,989)
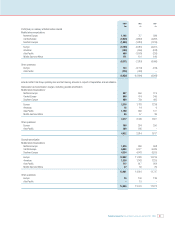
Exceptional non-operating items (note 6)
Mobile telecommunications:
Northern Europe (3) –(19)
Central Europe 2(20) –
Southern Europe (6) 52 261
Europe (7) 32 242
Americas (28) –(33)
Asia Pacific (295) (881) (134)
Middle East and Africa 1– 5
(329) (849) 80
Other operations:
Europe 348 (11) –
Asia Pacific (24) ––
(5) (860) 80