Vodafone 2003 Annual Report Download - page 76
Download and view the complete annual report
Please find page 76 of the 2003 Vodafone annual report below. You can navigate through the pages in the report by either clicking on the pages listed below, or by using the keyword search tool below to find specific information within the annual report.-
 1
1 -
2
-
3
-
4
-
5
-
6
-
7
-
8
-
9
-
10
-
11
-
12
-
13
-
14
-
15
-
16
-
17
-
18
-
19
-
20
-
21
-
22
-
23
-
24
-
25
-
26
-
27
-
28
-
29
-
30
-
31
-
32
-
33
-
34
-
35
-
36
-
37
-
38
-
39
-
40
-
41
-
42
-
43
-
44
-
45
-
46
-
47
-
48
-
49
-
50
-
51
-
52
-
53
-
54
-
55
-
56
-
57
-
58
-
59
-
60
-
61
-
62
-
63
-
64
-
65
-
 66
66 -
 67
67 -
 68
68 -
 69
69 -
 70
70 -
 71
71 -
 72
72 -
 73
73 -
 74
74 -
 75
75 -
 76
76 -
 77
77 -
 78
78 -
 79
79 -
 80
80 -
 81
81 -
 82
82 -
 83
83 -
 84
84 -
 85
85 -
 86
86 -
87
-
88
-
89
-
90
-
91
-
92
-
93
-
94
-
95
-
96
-
97
-
98
-
99
-
100
-
101
-
102
-
103
-
104
-
105
-
106
-
107
-
108
-
109
-
110
-
111
-
112
-
113
-
114
-
115
-
116
-
117
-
118
-
119
-
120
-
121
-
122
-
123
-
124
-
125
-
126
-
127
-
128
-
129
-
130
-
131
-
132
-
133
-
134
-
135
-
136
-
137
-
138
-
139
-
140
-
141
-
142
-
143
-
144
-
145
-
146
-
147
-
148
-
149
-
150
-
151
-
152
-
153
-
154
-
155
 |
 |

Vodafone Group Plc Annual Report & Accounts and Form 20-F 2003
74
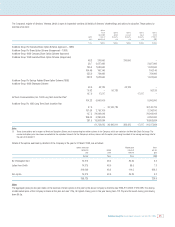
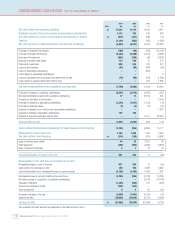
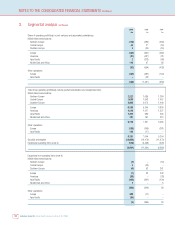
CONSOLIDATED CASH FLOWS FOR THE YEARS ENDED 31 MARCH
2003 2003 2002 2001
Note $m £m £m £m
Net cash inflow from operating activities 30 17,593 11,142 8,102 4,587
Dividends received from joint ventures and associated undertakings 1,172 742 139 353
Net cash outflow for returns on investments and servicing of finance 30 (870) (551) (936) (47)
Taxation (1,394) (883) (545) (1,585)
Net cash outflow for capital expenditure and financial investment (8,484) (5,373) (4,447) (19,011)
Purchase of intangible fixed assets (156) (99) (325) (13,163)
Purchase of tangible fixed assets (8,352) (5,289) (4,145) (3,698)
Purchase of investments (884) (560) (44) (3,254)
Disposal of tangible fixed assets 172 109 75 275
Disposal of investments 908 575 319 513
Loans to joint ventures (93) (59) (233) (85)
Loans to associated undertakings ––(523) –
Loans repaid by associated undertakings ––– 5
Loans to businesses sold or acquired businesses held for sale (79) (50) (116) (1,509)
Loans repaid by acquired businesses held for sale ––545 1,905
Net cash (outflow)/inflow from acquisitions and disposals (7,706) (4,880) (7,691) 30,653
Purchase of interests in subsidiary undertakings (5,557) (3,519) (3,078) (219)
Net cash/(overdrafts) acquired with subsidiary undertakings 17 11 (2,514) 542
Proceeds on formation of joint venture ––– 2,544
Purchase of interests in associated undertakings (2,354) (1,491) (7,159) (79)
Purchase of customer bases (9) (6) (11) (15)
Disposal of interests in joint ventures and associated undertakings ––– 1,878
Disposal of interests in subsidiary undertakings 197 125 ––
Disposal of acquired businesses held for sale ––5,071 26,002
Equity dividends paid (1,661) (1,052) (978) (773)
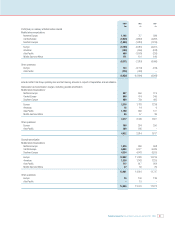
Cash (outflow)/inflow before management of liquid resources and financing (1,350) (855) (6,356) 14,177
Management of liquid resources 2,185 1,384 7,042 (7,541)
Net cash outflow from financing 30 (214) (136) (675) (6,691)
Issue of ordinary share capital 44 28 3,581 65
Debt repayment (260) (165) (4,268) (6,800)
Issue of shares to minorities 2112 44
Increase/(decrease) in cash in the year 621 393 11 (55)
Reconciliation of net cash flow to movement in net debt
Increase/(decrease) in cash in the year 621 393 11 (55)
Cash outflow from decrease in debt 260 165 4,268 6,800
Cash (inflow)/outflow from (decrease)/increase in liquid resources (2,185) (1,384) (7,042) 7,541
(Increase)/decrease in net debt resulting from cash flows (1,304) (826) (2,763) 14,286
Net debt acquired on acquisition of subsidiary undertakings ––(3,116) (13,726)
Translation difference (1,304) (826) 517 (629)
Premium on repayment of debt (248) (157) ––
Other movements 6450 (10)
Increase in net debt in the year (2,850) (1,805) (5,312) (79)
Opening net debt (19,002) (12,034) (6,722) (6,643)
Closing net debt 31 (21,852) (13,839) (12,034) (6,722)
The unaudited US dollar amounts are prepared on the basis set out in note 1.