Vodafone 2003 Annual Report Download - page 124
Download and view the complete annual report
Please find page 124 of the 2003 Vodafone annual report below. You can navigate through the pages in the report by either clicking on the pages listed below, or by using the keyword search tool below to find specific information within the annual report.-
 1
1 -
2
-
3
-
4
-
5
-
6
-
7
-
8
-
9
-
10
-
11
-
12
-
13
-
14
-
15
-
16
-
17
-
18
-
19
-
20
-
21
-
22
-
23
-
24
-
25
-
26
-
27
-
28
-
29
-
30
-
31
-
32
-
33
-
34
-
35
-
36
-
37
-
38
-
39
-
40
-
41
-
42
-
43
-
44
-
45
-
46
-
47
-
48
-
49
-
50
-
51
-
52
-
53
-
54
-
55
-
56
-
57
-
58
-
59
-
60
-
61
-
62
-
63
-
64
-
65
-
66
-
67
-
68
-
69
-
70
-
71
-
72
-
73
-
74
-
75
-
76
-
77
-
78
-
79
-
80
-
81
-
82
-
83
-
84
-
85
-
86
-
87
-
88
-
89
-
90
-
91
-
92
-
93
-
94
-
95
-
96
-
97
-
98
-
99
-
100
-
101
-
102
-
103
-
104
-
105
-
106
-
107
-
108
-
109
-
110
-
111
-
112
-
113
-
 114
114 -
 115
115 -
 116
116 -
 117
117 -
 118
118 -
 119
119 -
 120
120 -
 121
121 -
 122
122 -
 123
123 -
 124
124 -
 125
125 -
 126
126 -
 127
127 -
 128
128 -
 129
129 -
 130
130 -
 131
131 -
 132
132 -
 133
133 -
 134
134 -
135
-
136
-
137
-
138
-
139
-
140
-
141
-
142
-
143
-
144
-
145
-
146
-
147
-
148
-
149
-
150
-
151
-
152
-
153
-
154
-
155
 |
 |

Vodafone Group Plc Annual Report & Accounts and Form 20-F 2003
122
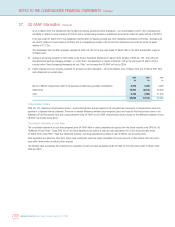
NOTES TO THE CONSOLIDATED FINANCIAL STATEMENTS Continued
37. US GAAP information
Index Page Page
Reconciliations to US GAAP 122 Summary of differences between UK GAAP and US GAAP 125
Net income 122 Future developments in US GAAP 128
Shareholders’ equity 123 Market risk and financial instruments 129
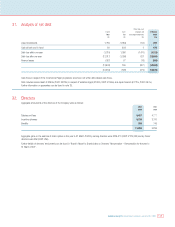
Total assets 123 Goodwill and other intangible assets 130
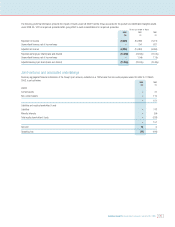
Comprehensive income 124 Joint ventures and associated undertakings 131
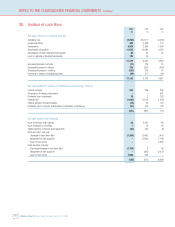
Consolidated statements of cash flows 124 Fixed asset investments 133
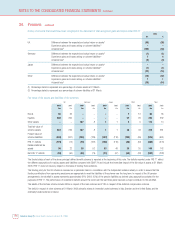
Stock based compensation 133
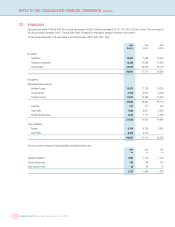
Pensions and other post retirement benefits 135
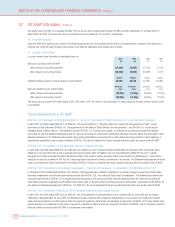
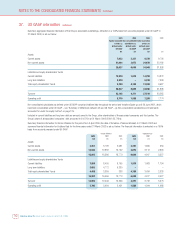
Reconciliations to US GAAP
The following is a summary of the effects of the differences between US Generally Accepted Accounting Principles (“US GAAP”) and UK Generally Accepted
Accounting Principles (“UK GAAP”) that are significant to the Group. The translation of pounds sterling amounts into US dollars is provided based on the Noon
Buying Rate on 31 March 2003 of $1.5790:£1.
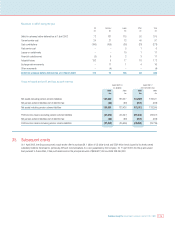
Net income 2003 2003(1) 2002 2001
as restated(2) as restated(2)
Note $m £m £m £m
Revenues as reported in accordance with UK GAAP 47,962 30,375 22,845 15,004
Items decreasing revenues:
Non-consolidated subsidiaries (a) (6,902) (4,371) (4,162) (3,409)
Connection revenues (b) (2,779) (1,760) (1,044) (492)
Revenues in accordance with US GAAP 38,281 24,244 17,639 11,103
Net loss as reported in accordance with UK GAAP (15,504) (9,819) (16,155) (9,885)
Items (increasing)/decreasing net loss:
Goodwill and other intangibles amortisation (c) (9,757) (6,179) (7,288) (3,034)
Investments accounted for under the equity method (a) 456 289 (537) 1,172
Exceptional items (d) 639 405 ––
Connection income (b) 25 16 (15) (54)
Capitalised interest (f) 644 408 387 365
Income taxes (g) 8,855 5,608 5,733 4,491
Minority interests (h) 425 269 1,308 (40)
Loss on disposal of business (i) ––(85) –
Other (e), (j) (81) (52) (53) (86)
Net loss before change in accounting principle in accordance with US GAAP (14,298) (9,055) (16,705) (7,071)
Effect of change in accounting principle(3) –– 17 –
Net loss after change in accounting principle, in accordance with US GAAP (14,298) (9,055) (16,688) (7,071)
US GAAP basic loss per ordinary share: (l)
– before change in accounting principle (20.98)¢ (13.29)p (24.58)p (11.51)p
– after change in accounting principle (20.98)¢ (13.29)p (24.56)p (11.51)p