Vodafone 2003 Annual Report Download - page 75
Download and view the complete annual report
Please find page 75 of the 2003 Vodafone annual report below. You can navigate through the pages in the report by either clicking on the pages listed below, or by using the keyword search tool below to find specific information within the annual report.-
 1
1 -
2
-
3
-
4
-
5
-
6
-
7
-
8
-
9
-
10
-
11
-
12
-
13
-
14
-
15
-
16
-
17
-
18
-
19
-
20
-
21
-
22
-
23
-
24
-
25
-
26
-
27
-
28
-
29
-
30
-
31
-
32
-
33
-
34
-
35
-
36
-
37
-
38
-
39
-
40
-
41
-
42
-
43
-
44
-
45
-
46
-
47
-
48
-
49
-
50
-
51
-
52
-
53
-
54
-
55
-
56
-
57
-
58
-
59
-
60
-
61
-
62
-
63
-
64
-
 65
65 -
 66
66 -
 67
67 -
 68
68 -
 69
69 -
 70
70 -
 71
71 -
 72
72 -
 73
73 -
 74
74 -
 75
75 -
 76
76 -
 77
77 -
 78
78 -
 79
79 -
 80
80 -
 81
81 -
 82
82 -
 83
83 -
 84
84 -
 85
85 -
86
-
87
-
88
-
89
-
90
-
91
-
92
-
93
-
94
-
95
-
96
-
97
-
98
-
99
-
100
-
101
-
102
-
103
-
104
-
105
-
106
-
107
-
108
-
109
-
110
-
111
-
112
-
113
-
114
-
115
-
116
-
117
-
118
-
119
-
120
-
121
-
122
-
123
-
124
-
125
-
126
-
127
-
128
-
129
-
130
-
131
-
132
-
133
-
134
-
135
-
136
-
137
-
138
-
139
-
140
-
141
-
142
-
143
-
144
-
145
-
146
-
147
-
148
-
149
-
150
-
151
-
152
-
153
-
154
-
155
 |
 |
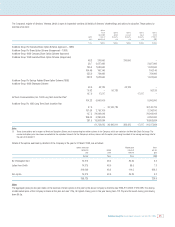
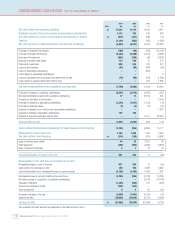
Vodafone Group Plc Annual Report & Accounts and Form 20-F 2003 73
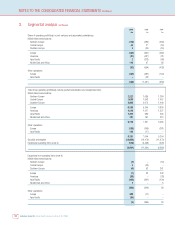
BALANCE SHEETS AT 31 MARCH
Group Company
2003 2003 2002 2003 2002
Note $m £m £m £m £m
Fixed assets
Intangible assets 11 170,667 108,085 105,944 ––
Tangible assets 12 30,907 19,574 18,541 ––
Investments 42,680 27,030 28,977 104,655 103,299
Investments in joint ventures:
Loans to joint ventures 13 ––321 –321
Investments in associated undertakings 13 40,777 25,825 27,249 –9
Other investments 13 1,903 1,205 1,407 104,655 102,969
244,254 154,689 153,462 104,655 103,299
Current assets
Stocks 15 576 365 513 ––
Debtors 16 11,779 7,460 7,053 44,699 33,190
Investments 17 460 291 1,792 287 –
Cash at bank and in hand 750 475 80 215 –
13,565 8,591 9,438 45,201 33,190
Creditors: amounts falling due within one year 18 (22,569) (14,293) (13,455) (76,087) (70,073)
Net current liabilities (9,004) (5,702) (4,017) (30,886) (36,883)
Total assets less current liabilities 235,250 148,987 149,445 73,769 66,416
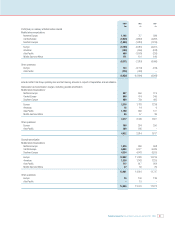
Creditors: amounts falling due after more than one year 19 (21,722) (13,757) (13,118) (8,171) (5,725)
Provisions for liabilities and charges (5,836) (3,696) (2,899) ––
Investments in joint ventures:
Share of gross assets ––76 ––
Share of gross liabilities ––(345) ––
13 ––(269) ––
Other provisions 22 (5,836) (3,696) (2,630) ––
207,692 131,534 133,428 65,598 60,691
Capital and reserves
Called up share capital 23 6,750 4,275 4,273 4,275 4,273
Share premium account 24 82,223 52,073 52,044 52,073 52,044
Merger reserve 24 156,206 98,927 98,927 ––
Capital reserve –––88 88
Other reserve 24 1,331 843 935 843 935
Profit and loss account 24 (43,339) (27,447) (25,606) 8,319 3,351
Total equity shareholders’ funds 203,171 128,671 130,573 65,598 60,691
Equity minority interests 2,918 1,848 1,727 ––
Non-equity minority interests 25 1,603 1,015 1,128 ––
207,692 131,534 133,428 65,598 60,691
The financial statements on pages 72 to 138 were approved by the Board of directors on 27 May 2003 and were signed on its behalf by:
SIR CHRISTOPHER GENT Chief Executive
K J HYDON Financial Director
The accompanying notes are an integral part of these Consolidated Financial Statements.
The unaudited US dollar amounts are prepared on the basis set out in note 1.