US Cellular 2015 Annual Report Download - page 99
Download and view the complete annual report
Please find page 99 of the 2015 US Cellular annual report below. You can navigate through the pages in the report by either clicking on the pages listed below, or by using the keyword search tool below to find specific information within the annual report.-
 1
1 -
2
-
3
-
4
-
5
-
6
-
7
-
8
-
9
-
10
-
11
-
12
-
13
-
14
-
15
-
16
-
17
-
18
-
19
-
20
-
21
-
22
-
23
-
24
-
25
-
26
-
27
-
28
-
29
-
30
-
31
-
32
-
33
-
34
-
35
-
36
-
37
-
38
-
39
-
40
-
41
-
42
-
43
-
44
-
45
-
46
-
47
-
48
-
49
-
50
-
51
-
52
-
53
-
54
-
55
-
56
-
57
-
58
-
59
-
60
-
61
-
62
-
63
-
64
-
65
-
66
-
67
-
68
-
69
-
70
-
71
-
72
-
73
-
74
-
75
-
76
-
77
-
78
-
79
-
80
-
81
-
82
-
83
-
84
-
85
-
86
-
87
-
88
-
 89
89 -
 90
90 -
 91
91 -
 92
92 -
 93
93 -
 94
94 -
 95
95 -
 96
96 -
 97
97 -
 98
98 -
 99
99 -
 100
100 -
 101
101 -
 102
102 -
 103
103 -
 104
104 -
 105
105 -
 106
106 -
 107
107 -
 108
108 -
 109
109 -
110
-
111
-
112
-
113
-
114
-
115
-
116
-
117
-
118
-
119
-
120
-
121
-
122
-
123
-
124
 |
 |

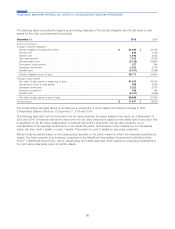
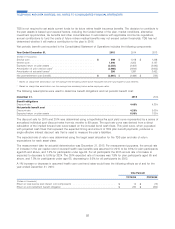
December 31, 2015 Level 1 Level 2 Total
(Dollars in thousands)
Mutual funds
International equity1................................... $ 11,912 $ – $ 11,912
Money market2...................................... 3,139 – 3,139
US large cap3....................................... 22,327 – 22,327
Bank common trust
Bond4............................................ – 12,630 12,630
Total plan assets at fair value ............................... $ 37,378 $ 12,630 $ 50,008
December 31, 2014 Level 1 Level 2 Total
(Dollars in thousands)
Mutual funds
Bond5.......................................... $ 12,842 $ – $ 12,842
International equity1................................. 12,003 – 12,003
Money market2.................................... 2,053 – 2,053
US large cap3..................................... 20,191 – 20,191
US small cap6.................................... 4,234 – 4,234
Other ........................................... – 1 1
Total plan assets at fair value ............................. $ 51,323 $ 1 $ 51,324
1International equity – This type of fund seeks to provide long-term capital appreciation by investing in the stocks of companies located outside the
United States that are considered to have the potential for above-average capital appreciation.
2Money market – This type of fund seeks as high a level of current income as is consistent with the preservation of capital and the maintenance of
liquidity by investing in a diversified portfolio of high-quality, dollar-denominated short-term debt securities.
3US large cap – This type of fund seeks to track the performance of several benchmark indices that measure the investment return of large-capitalization
stocks. The funds attempt to replicate the indices by investing substantially all of their assets in the stocks that make up the various indices in
approximately the same proportion as the weighting in the indices.
4Bond (bank common trust) – This type of fund seeks to achieve maximum total return by investing in Bond Index Funds and other short-term
investments.
5Bond (mutual funds) – This type of fund seeks to achieve a maximum total return, consistent with preservation of capital and prudent investment
management by investing in a wide spectrum of fixed income instruments including bonds, debt securities and other similar instruments issued by
government and private-sector entities.
6US small cap – This type of fund seeks to track the performance of a benchmark index that measures the investment return of small-capitalization
stocks. The fund attempts to replicate the index by investing substantially all of its assets in the stocks that make up the index in approximately the
same proportion as the weighting in the index.
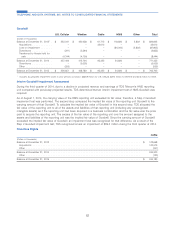
The following table summarizes how plan assets are invested.
Allocation of Plan Assets
at December 31,
Investment Target Asset
Category Allocation 2015 2014
U.S. equities ....................................... 45% 44.7% 47.6%
International equities .................................. 25% 23.8% 23.4%
Debt securities ..................................... 30% 31.5% 29.0%
The post-retirement benefit fund engages multiple asset managers to ensure proper diversification of the investment
portfolio within each asset category. The investment objective is to meet or exceed the rate of return of a performance
index comprised of 45% Dow Jones U.S. Total Stock Market Index, 25% FTSE All World (excluding U.S.) Stock Index,
and 30% Barclays Capital Aggregate Bond Index. The three-year and five-year average rates of return for TDS’ post-
retirement benefit fund are 8.02% and 7.40%, respectively.
The post-retirement benefit fund does not hold any debt or equity securities issued by TDS, U.S. Cellular or any related
parties.
91
TELEPHONE AND DATA SYSTEMS, INC. NOTES TO CONSOLIDATED FINANCIAL STATEMENTS