US Cellular 2015 Annual Report Download - page 32
Download and view the complete annual report
Please find page 32 of the 2015 US Cellular annual report below. You can navigate through the pages in the report by either clicking on the pages listed below, or by using the keyword search tool below to find specific information within the annual report.-
 1
1 -
2
-
3
-
4
-
5
-
6
-
7
-
8
-
9
-
10
-
11
-
12
-
13
-
14
-
15
-
16
-
17
-
18
-
19
-
20
-
21
-
 22
22 -
 23
23 -
 24
24 -
 25
25 -
 26
26 -
 27
27 -
 28
28 -
 29
29 -
 30
30 -
 31
31 -
 32
32 -
 33
33 -
 34
34 -
 35
35 -
 36
36 -
 37
37 -
 38
38 -
 39
39 -
 40
40 -
 41
41 -
 42
42 -
43
-
44
-
45
-
46
-
47
-
48
-
49
-
50
-
51
-
52
-
53
-
54
-
55
-
56
-
57
-
58
-
59
-
60
-
61
-
62
-
63
-
64
-
65
-
66
-
67
-
68
-
69
-
70
-
71
-
72
-
73
-
74
-
75
-
76
-
77
-
78
-
79
-
80
-
81
-
82
-
83
-
84
-
85
-
86
-
87
-
88
-
89
-
90
-
91
-
92
-
93
-
94
-
95
-
96
-
97
-
98
-
99
-
100
-
101
-
102
-
103
-
104
-
105
-
106
-
107
-
108
-
109
-
110
-
111
-
112
-
113
-
114
-
115
-
116
-
117
-
118
-
119
-
120
-
121
-
122
-
123
-
124
 |
 |

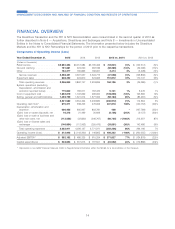
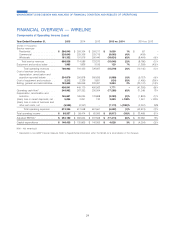
FINANCIAL OVERVIEW — WIRELINE
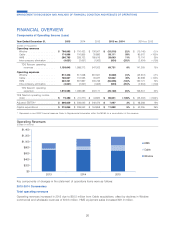
Components of Operating Income (Loss)
Year Ended December 31, 2015 2014 2013 2015 vs. 2014 2014 vs. 2013
(Dollars in thousands)
Service revenues
Residential ............... $ 296,943 $ 293,304 $ 293,217 $ 3,639 1% $87 –
Commercial .............. 220,643 229,306 229,715 (8,663) (4)% (409) –
Wholesale ............... 181,352 191,976 200,440 (10,624) (6)% (8,464) (4)%
Total service revenues ...... 698,938 714,586 723,372 (15,648) (2)% (8,786) (1)%
Equipment and product sales .... 1,965 1,836 3,195 129 7% (1,359) (43)%
Total operating revenues . . . 700,903 716,422 726,567 (15,519) (2)% (10,145) (1)%
Cost of services (excluding
depreciation, amortization and
accretion reported below) ..... 254,879 256,878 266,635 (1,999) (1)% (9,757) (4)%
Cost of equipment and products . . 2,212 2,336 3,831 (124) (5)% (1,495) (39)%
Selling, general and administrative . 193,850 189,956 220,097 3,894 2% (30,141) (14)%
450,941 449,170 490,563 1,771 – (41,393) (8)%
Operating cash flow* .......... 249,962 267,252 236,004 (17,290) (6)% 31,248 13%
Depreciation, amortization and
accretion ................ 165,841 169,044 170,868 (3,203) (2)% (1,824) (1)%
(Gain) loss on asset disposals, net . 5,094 2,091 130 3,003 >100% 1,961 >100%
(Gain) loss on sale of business and
other exit costs, net ......... (9,530) (2,357) – (7,173) >(100)% (2,357) N/M
Total operating expenses . . . 612,346 617,948 661,561 (5,602) (1)% (43,613) (7)%
Total operating income ......... $ 88,557 $ 98,474 $ 65,006 $ (9,917) (10)% $ 33,468 51%
Adjusted EBITDA* ........... $ 252,150 $ 269,624 $ 237,568 $ (17,474) (6)% $ 32,056 13%
Capital expenditures .......... $ 140,433 $ 135,805 $ 140,009 $ 4,628 3% $ (4,204) (3)%
N/M – Not meaningful
* Represents a non-GAAP financial measure. Refer to Supplemental Information within this MD&A for a reconciliation of this measure.
24
MANAGEMENT’S DISCUSSION AND ANALYSIS OF FINANCIAL CONDITION AND RESULTS OF OPERATIONS