US Cellular 2015 Annual Report Download - page 16
Download and view the complete annual report
Please find page 16 of the 2015 US Cellular annual report below. You can navigate through the pages in the report by either clicking on the pages listed below, or by using the keyword search tool below to find specific information within the annual report.-
 1
1 -
2
-
3
-
4
-
5
-
 6
6 -
 7
7 -
 8
8 -
 9
9 -
 10
10 -
 11
11 -
 12
12 -
 13
13 -
 14
14 -
 15
15 -
 16
16 -
 17
17 -
 18
18 -
 19
19 -
 20
20 -
 21
21 -
 22
22 -
 23
23 -
 24
24 -
 25
25 -
 26
26 -
27
-
28
-
29
-
30
-
31
-
32
-
33
-
34
-
35
-
36
-
37
-
38
-
39
-
40
-
41
-
42
-
43
-
44
-
45
-
46
-
47
-
48
-
49
-
50
-
51
-
52
-
53
-
54
-
55
-
56
-
57
-
58
-
59
-
60
-
61
-
62
-
63
-
64
-
65
-
66
-
67
-
68
-
69
-
70
-
71
-
72
-
73
-
74
-
75
-
76
-
77
-
78
-
79
-
80
-
81
-
82
-
83
-
84
-
85
-
86
-
87
-
88
-
89
-
90
-
91
-
92
-
93
-
94
-
95
-
96
-
97
-
98
-
99
-
100
-
101
-
102
-
103
-
104
-
105
-
106
-
107
-
108
-
109
-
110
-
111
-
112
-
113
-
114
-
115
-
116
-
117
-
118
-
119
-
120
-
121
-
122
-
123
-
124
 |
 |

11MAR201618464870
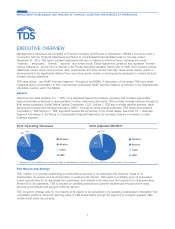
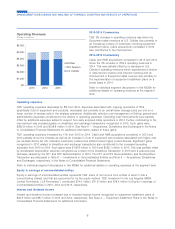
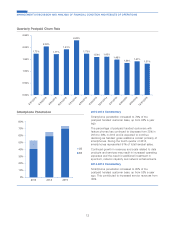
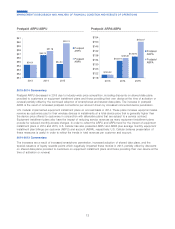
Adjusted EBITDA increased due primarily to increased
revenues and decreased cash expenses in U.S. Cellular’s
operations. U.S. Cellular’s Loss on equipment (Equipment
sales less Cost of equipment sold) decreased
$291.5 million from 2014 to 2015 as a result of the
continued adoption of equipment installment plans, less
devices sold, and a lower average cost per device sold.
Net income (loss) increased from 2014 to 2015 due to the
same reasons as Adjusted EBITDA, and also due to an
increase in Gain on sale of business and other exit costs
in U.S. Cellular, and a Loss on impairment of Goodwill
recognized in the HMS segment in 2014.
Adjusted EBITDA decreased due primarily to decreased
revenues and increased cash expenses in U.S. Cellular’s
operations. U.S. Cellular’s Service revenues declined due
to a decrease in the average retail customer base and a
decrease in Inbound roaming revenue, among other
factors. Net income (loss) decreased from 2013 to 2014
$167
($147)
$263
$870
$781
$1,160
($400)
($200)
$0
$200
$400
$600
$800
$1,000
$1,200
$1,400
2013 2014 2015
Net Income
(Loss)
Adjusted
EBITDA*
due to the same reasons as Adjusted EBITDA, and also
due to a decrease in both Gain on sale of business and
other exit costs and Gain on license sales and exchanges
in U.S. Cellular. In addition, a Loss on impairment of
Goodwill recognized in the HMS segment in 2014 further
decreased Net income from 2013 to 2014.
* Represents a non-GAAP measure. Refer to Supplemental Information within this MD&A for a reconciliation of this measure.
8
MANAGEMENT’S DISCUSSION AND ANALYSIS OF FINANCIAL CONDITION AND RESULTS OF OPERATIONS
2015-2014 Commentary
2014-2013 Commentary
Earnings
(Dollars in millions)