US Cellular 2015 Annual Report Download - page 28
Download and view the complete annual report
Please find page 28 of the 2015 US Cellular annual report below. You can navigate through the pages in the report by either clicking on the pages listed below, or by using the keyword search tool below to find specific information within the annual report.-
 1
1 -
2
-
3
-
4
-
5
-
6
-
7
-
8
-
9
-
10
-
11
-
12
-
13
-
14
-
15
-
16
-
17
-
 18
18 -
 19
19 -
 20
20 -
 21
21 -
 22
22 -
 23
23 -
 24
24 -
 25
25 -
 26
26 -
 27
27 -
 28
28 -
 29
29 -
 30
30 -
 31
31 -
 32
32 -
 33
33 -
 34
34 -
 35
35 -
 36
36 -
 37
37 -
 38
38 -
39
-
40
-
41
-
42
-
43
-
44
-
45
-
46
-
47
-
48
-
49
-
50
-
51
-
52
-
53
-
54
-
55
-
56
-
57
-
58
-
59
-
60
-
61
-
62
-
63
-
64
-
65
-
66
-
67
-
68
-
69
-
70
-
71
-
72
-
73
-
74
-
75
-
76
-
77
-
78
-
79
-
80
-
81
-
82
-
83
-
84
-
85
-
86
-
87
-
88
-
89
-
90
-
91
-
92
-
93
-
94
-
95
-
96
-
97
-
98
-
99
-
100
-
101
-
102
-
103
-
104
-
105
-
106
-
107
-
108
-
109
-
110
-
111
-
112
-
113
-
114
-
115
-
116
-
117
-
118
-
119
-
120
-
121
-
122
-
123
-
124
 |
 |

11MAR201618465276
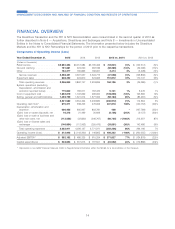
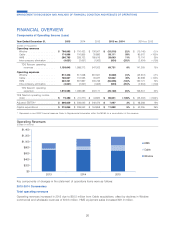
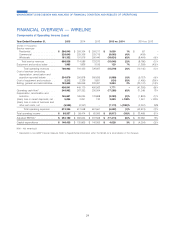
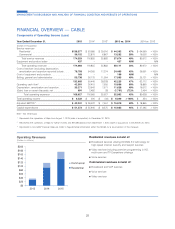
FINANCIAL OVERVIEW
Components of Operating Income (Loss)
Year Ended December 31, 2015 2014 2013 2015 vs. 2014 2014 vs. 2013
(Dollars in thousands)
Operating revenues
Wireline ................ $ 700,903 $ 716,422 $ 726,567 $ (15,519) (2)% $ (10,145) (1)%
Cable .................. 174,966 116,855 35,883 58,111 50% 80,972 >100%
HMS .................. 286,795 258,732 185,616 28,063 11% 73,116 39%
Intra-company elimination ..... (4,621) (3,697) (1,063) (924) (25)% (2,634) >(100)
TDS Telecom operating
revenues ............. 1,158,043 1,088,312 947,003 69,731 6% 141,309 15%
Operating expenses
Wireline ................ 612,346 617,948 661,561 (5,602) (1)% (43,613) (7)%
Cable .................. 168,627 116,565 35,927 52,062 45% 80,638 >100%
HMS .................. 302,231 367,867 205,746 (65,636) (18)% 162,121 79%
Intra-company elimination ..... (4,621) (3,697) (1,063) (924) (25)% (2,634) >(100)
TDS Telecom operating
expenses ............. 1,078,583 1,098,683 902,171 (20,100) (2)% 196,512 22%
TDS Telecom operating income
(loss) .................. $ 79,460 $ (10,371) $ 44,832 $ 89,831 >100% $ (55,203) >(100)%
Adjusted EBITDA* ........... $ 306,029 $ 298,042 $ 249,474 $ 7,987 3% $ 48,568 19%
Capital expenditures .......... $ 219,065 $ 208,063 $ 164,858 $ 11,002 5% $ 43,205 26%
* Represents a non-GAAP financial measure. Refer to Supplemental Information within this MD&A for a reconciliation of this measure.
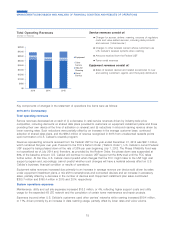
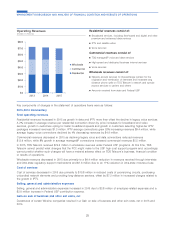
Operating Revenues
(Dollars in millions)
$0
$200
$400
$600
$800
$1,000
$1,200
$1,400
2013 2014 2015
HMS
Cable
Wireline
Key components of changes in the statement of operations items were as follows:
2015-2014 Commentary
Total operating revenues
Operating revenues increased in 2015 due to $55.5 million from Cable acquisitions, offset by declines in Wireline
commercial and wholesale revenues of $19.3 million. HMS equipment sales increased $21.0 million.
20
MANAGEMENT’S DISCUSSION AND ANALYSIS OF FINANCIAL CONDITION AND RESULTS OF OPERATIONS