US Cellular 2015 Annual Report Download - page 100
Download and view the complete annual report
Please find page 100 of the 2015 US Cellular annual report below. You can navigate through the pages in the report by either clicking on the pages listed below, or by using the keyword search tool below to find specific information within the annual report.-
 1
1 -
2
-
3
-
4
-
5
-
6
-
7
-
8
-
9
-
10
-
11
-
12
-
13
-
14
-
15
-
16
-
17
-
18
-
19
-
20
-
21
-
22
-
23
-
24
-
25
-
26
-
27
-
28
-
29
-
30
-
31
-
32
-
33
-
34
-
35
-
36
-
37
-
38
-
39
-
40
-
41
-
42
-
43
-
44
-
45
-
46
-
47
-
48
-
49
-
50
-
51
-
52
-
53
-
54
-
55
-
56
-
57
-
58
-
59
-
60
-
61
-
62
-
63
-
64
-
65
-
66
-
67
-
68
-
69
-
70
-
71
-
72
-
73
-
74
-
75
-
76
-
77
-
78
-
79
-
80
-
81
-
82
-
83
-
84
-
85
-
86
-
87
-
88
-
89
-
 90
90 -
 91
91 -
 92
92 -
 93
93 -
 94
94 -
 95
95 -
 96
96 -
 97
97 -
 98
98 -
 99
99 -
 100
100 -
 101
101 -
 102
102 -
 103
103 -
 104
104 -
 105
105 -
 106
106 -
 107
107 -
 108
108 -
 109
109 -
 110
110 -
111
-
112
-
113
-
114
-
115
-
116
-
117
-
118
-
119
-
120
-
121
-
122
-
123
-
124
 |
 |

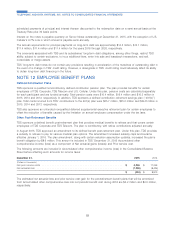
TDS is not required to set aside current funds for its future retiree health insurance benefits. The decision to contribute to
the plan assets is based upon several factors, including the funded status of the plan, market conditions, alternative
investment opportunities, tax benefits and other circumstances. In accordance with applicable income tax regulations,
annual contributions to fund the costs of future retiree medical benefits may not exceed certain thresholds. TDS has not
determined whether it will make a contribution to the plan in 2016.
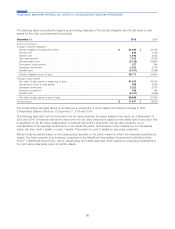
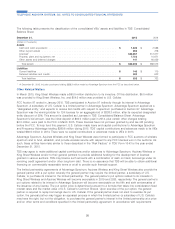
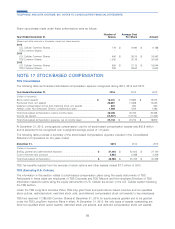
Net periodic benefit cost recorded in the Consolidated Statement of Operations includes the following components:
Year Ended December 31, 2015 2014 2013
(Dollars in thousands)
Service cost ....................................... $ 549 $ 1,018 $ 1,348
Interest cost ....................................... 1,540 2,255 2,137
Expected return on plan assets ........................... (3,252) (3,402) (3,065)
Amortization of prior service costs1........................ (2,988) (3,644) (3,605)
Amortization of actuarial losses2.......................... 290 1,287 2,452
Net post-retirement cost (benefit) .......................... $ (3,861) $ (2,486) $ (733)
1Based on straight-line amortization over the average time remaining before active employees become fully eligible for plan benefits.
2Based on straight-line amortization over the average time remaining before active employees retire.
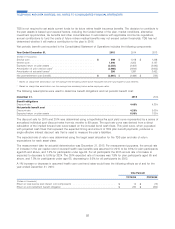
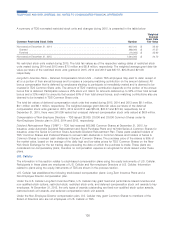
The following assumptions were used to determine benefit obligations and net periodic benefit cost:
December 31, 2015 2014
Benefit obligations
Discount rate ................................................... 4.40% 4.20%
Net periodic benefit cost
Discount rate ................................................... 4.20% 5.00%
Expected return on plan assets ........................................ 6.50% 7.00%
The discount rate for 2015 and 2014 was determined using a hypothetical Aa spot yield curve represented by a series of
annualized individual spot discount rates from six months to 99 years. The spot rate curve was derived from a direct
calculation of the implied forward rate curve based on the included bond cash flows. This yield curve, when populated
with projected cash flows that represent the expected timing and amount of TDS plan benefit payments, produces a
single effective interest discount rate that is used to measure the plan’s liabilities.
The expected rate of return was determined using the target asset allocation for the TDS plan and rate of return
expectations for each asset class.
The measurement date for actuarial determination was December 31, 2015. For measurement purposes, the annual rate
of increase in the per capita cost of covered health care benefits was assumed for 2015 to be 9.5% for plan participants
aged 65 and above, and 7.3% for participants under age 65. For all participants the 2015 annual rate of increase is
expected to decrease to 5.0% by 2024. The 2014 expected rate of increase was 7.8% for plan participants aged 65 and
above, and 7.5% for participants under age 65, decreasing to 5.0% for all participants by 2022.
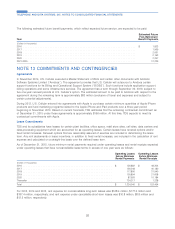
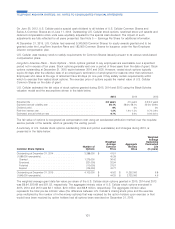
A 1% increase or decrease in assumed health care cost trend rates would have the following effects as of and for the
year ended December 31, 2015:
One Percent
Increase Decrease
(Dollars in thousands)
Effect on total service and interest cost components .......................... $ 14 $ (13)
Effect on post-retirement benefit obligation ................................ $ 230 $ (202)
92
TELEPHONE AND DATA SYSTEMS, INC. NOTES TO CONSOLIDATED FINANCIAL STATEMENTS